¶ Dashboards
TradeGrub Dashboards give you a fully customizable trading workspace for monitoring markets, managing positions, and executing trades — all from a single screen. Choose from preloaded templates or build your own layout with 50+ widgets tailored to your trading style.
¶ Key Features
- Customizable Dashboards — Configure multiple layouts with widgets tailored to your trading preferences.
- Quick Trade — Place trades rapidly using pre-set quantities and action buttons such as BUY LMT and SELL LMT.
- Custom Buttons — Set up personalized hotbuttons and keyboard shortcuts (hotkeys) for limit orders, stop orders, and other frequent actions.
- Real-Time Data — Monitor live price, volume, and market movements across different symbols.
- Charting Tools — Integrated charting with advanced layouts and technical indicators, powered by TradingView.
- Time & Sales — Track recent trades with a time-stamped record of prices and sizes.
- Widget Management — Add, remove, resize, and rearrange widgets using drag-and-drop.
- Cloud Storage — Dashboard configurations are saved to the cloud for seamless access across multiple devices. Export and import layouts as needed.
¶ Getting Started
When you first sign in, four dashboards are enabled by default: Overview, Stock, Crypto, and Screeners. Each appears as a tab at the top of the screen. Tap a tab to switch between them.
¶ Preloaded Dashboards
¶ Overview
A broad market summary with a ticker tape, mini charts for major indices and crypto (DIA, QQQ, SPY, BTC, ETH), a stock heatmap, market summary, news, and an economic calendar.
¶ Stock
A trading-focused layout built for equities. Includes a quote panel, candlestick chart, time & sales, quick trade entry, order book (Level 2), news feed, and a tabbed group for positions, transactions, gains, and orders.
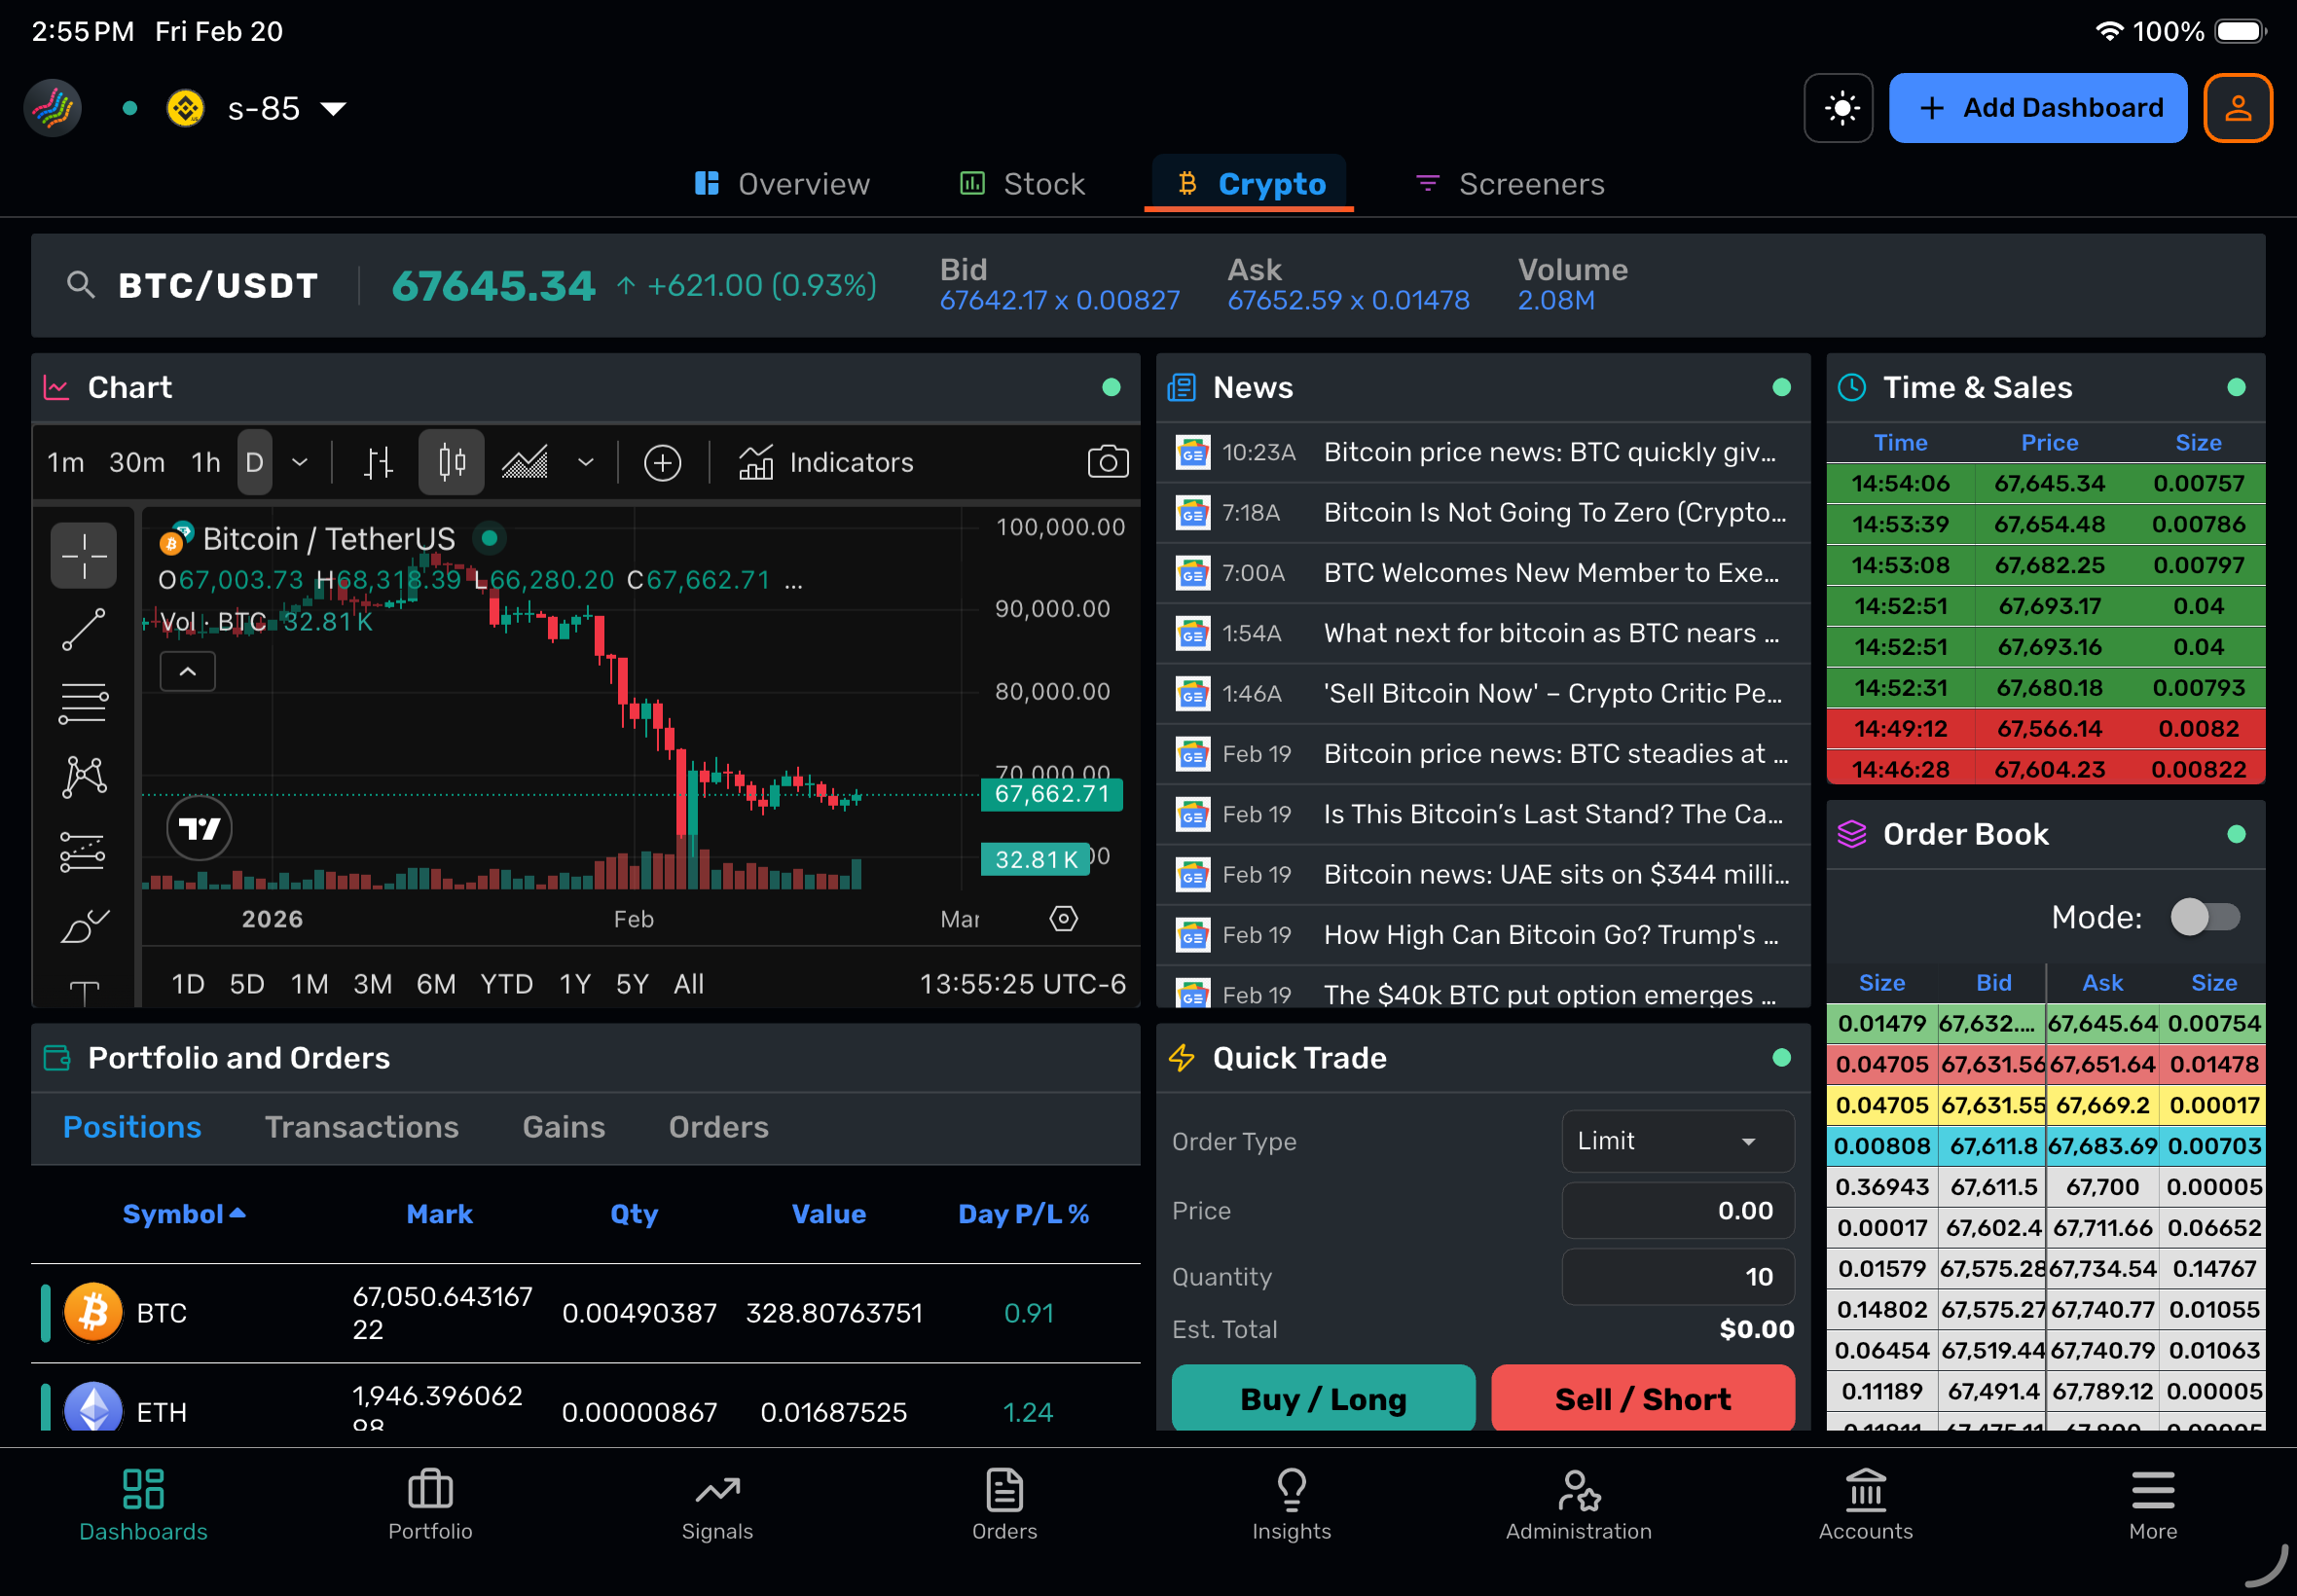
¶ Crypto
Similar to the Stock dashboard but optimized for cryptocurrency pairs such as BTC/USDT and ETH/USDT.
¶ Screeners
An advanced screening dashboard for filtering and discovering stocks based on custom criteria.
¶ Dashboard Library
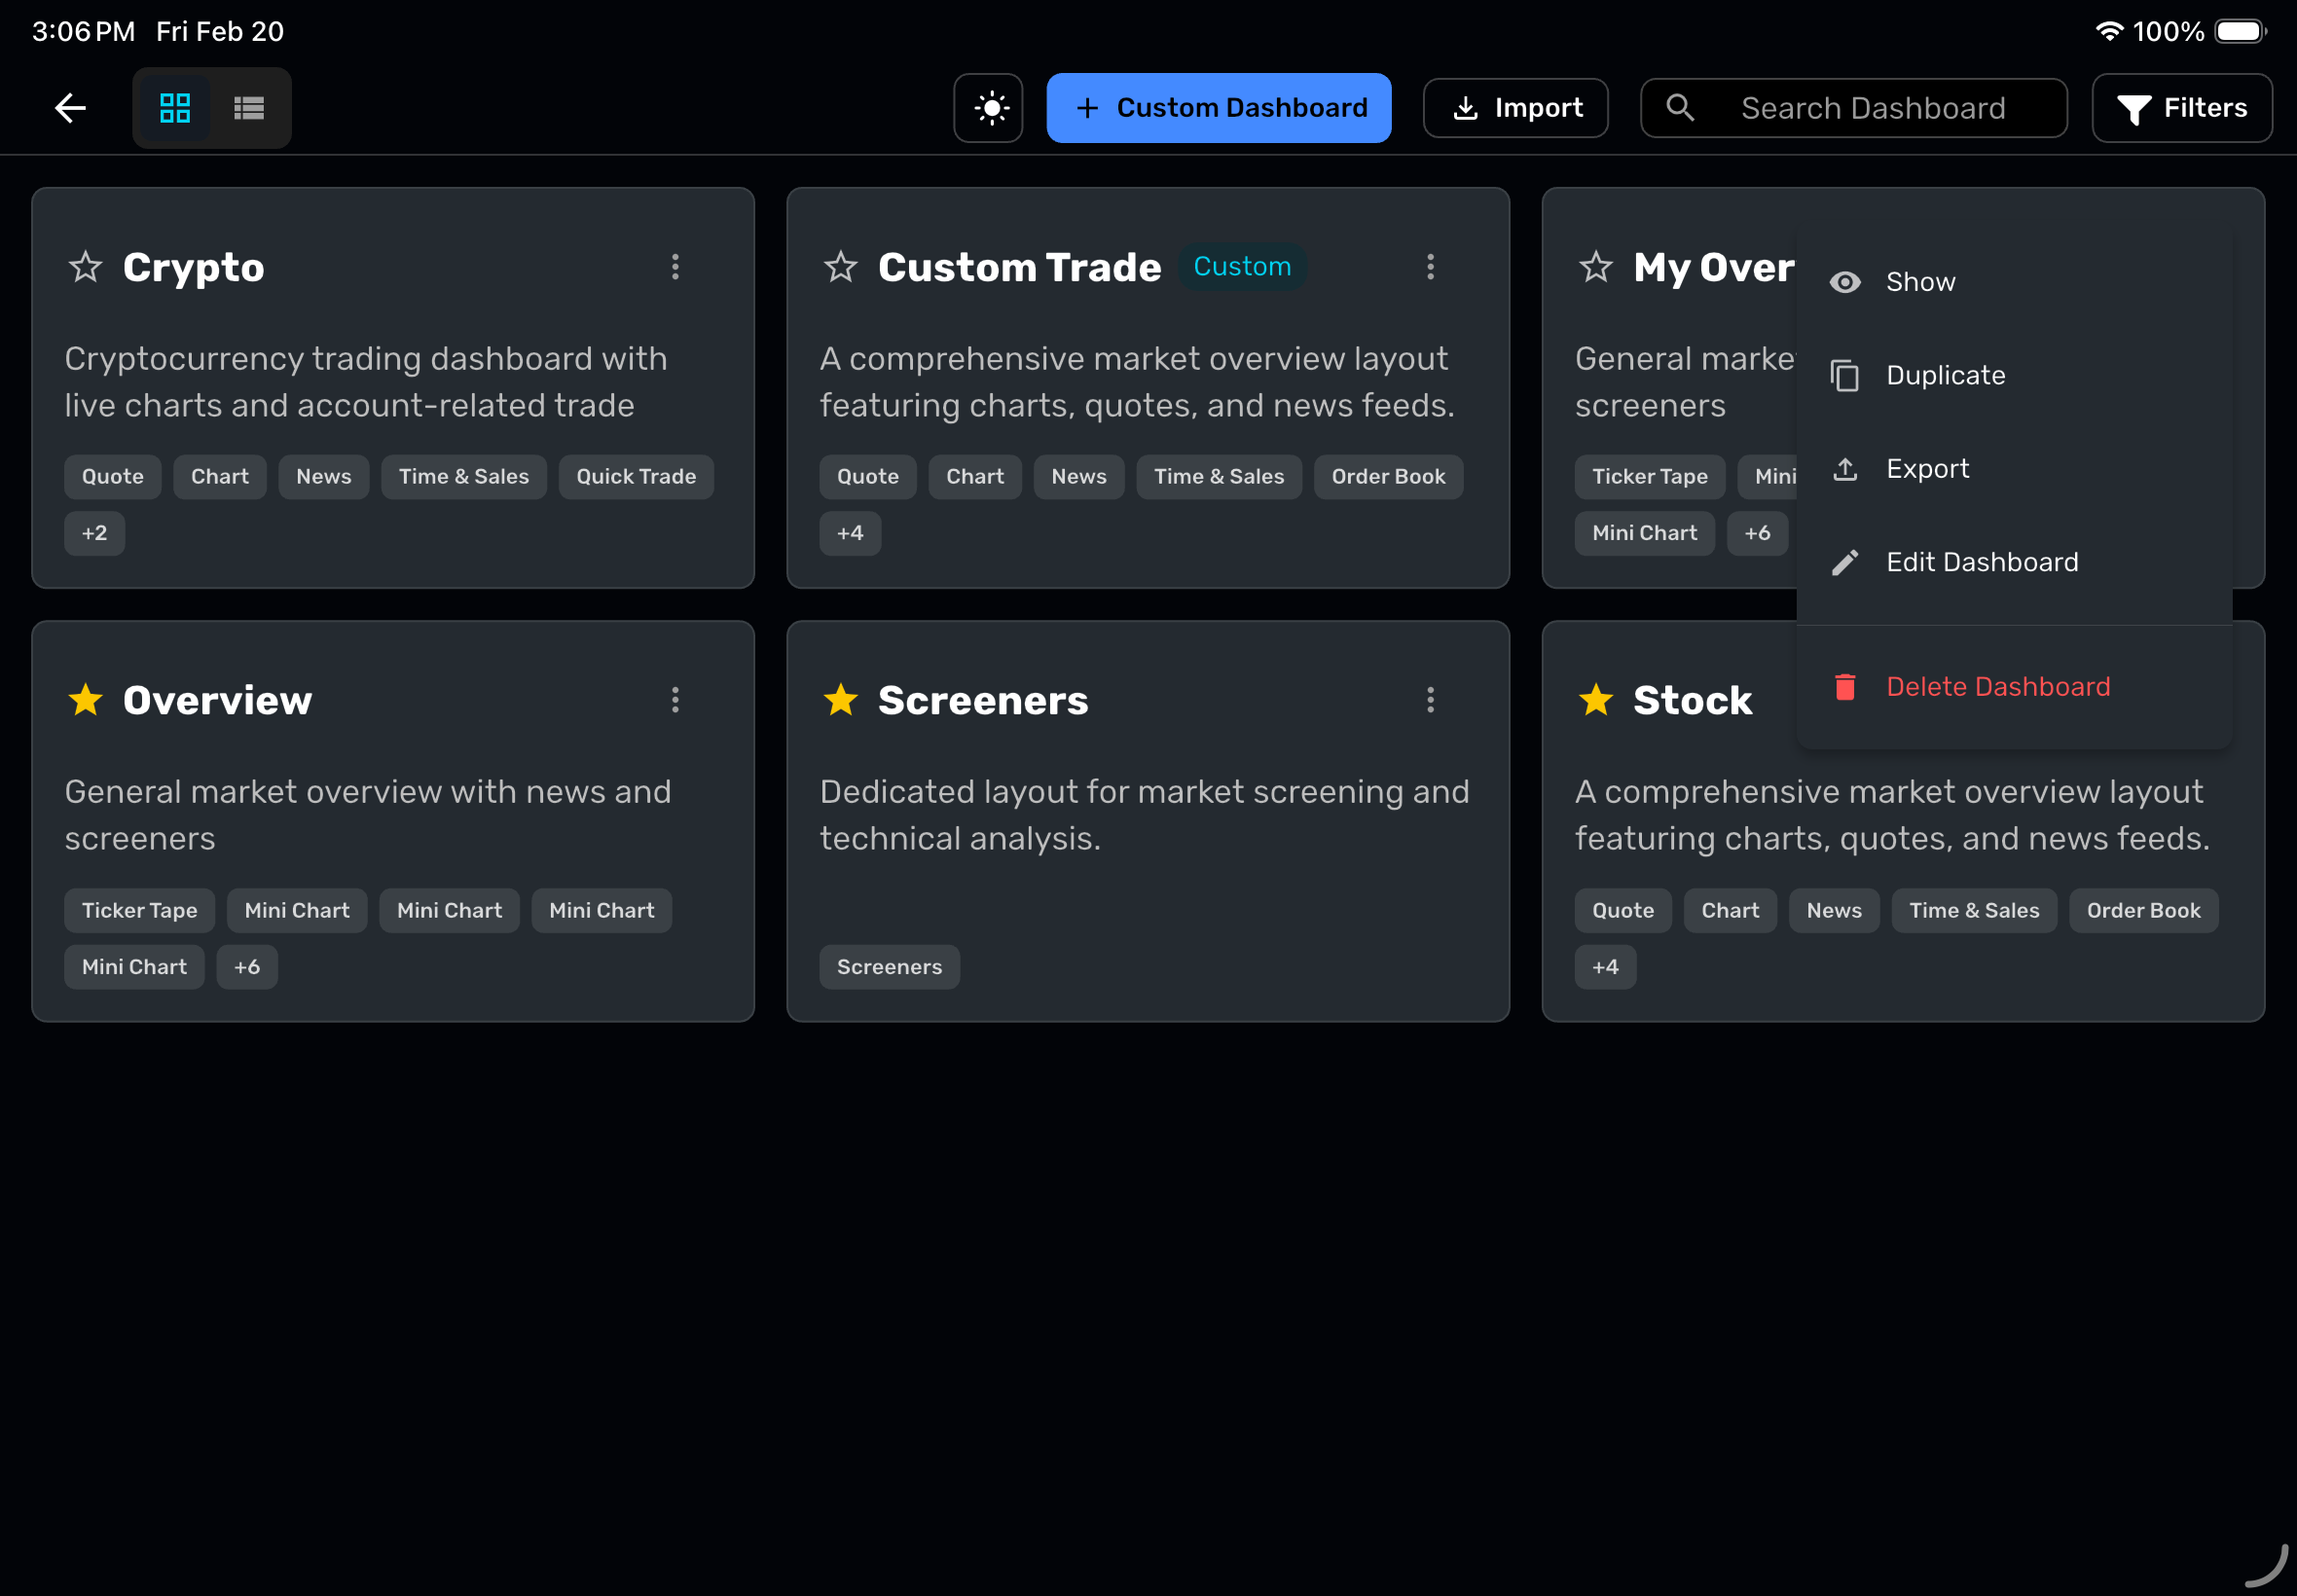
Tap Add Dashboard in the top bar to open the Dashboard Library. From here you can browse, search, and manage all of your dashboards.
¶ Browsing
- Grid View shows dashboard cards with descriptions and widget previews.
- List View shows a sortable table with dashboard name, description, and widget count.
- Search by name or description using the search bar.
- Filter by category (Stocks, Crypto, Both), type (Custom, Preloaded), or visibility (Visible, Hidden).
- Sort columns by name, description, or widget count.
¶ Dashboard Actions
Each dashboard has a menu with the following options:
| Action | Description |
|---|---|
| Toggle Visibility | Show or hide the dashboard from your main tab bar. |
| Duplicate | Create an editable copy of any dashboard, including preloaded ones. |
| Export | Download the dashboard configuration as a JSON file. |
| Edit | Open the layout editor (custom dashboards only). |
| Delete | Permanently remove the dashboard (custom dashboards only). |
Preloaded dashboards cannot be edited or deleted directly. To customize one, duplicate it first.
¶ 
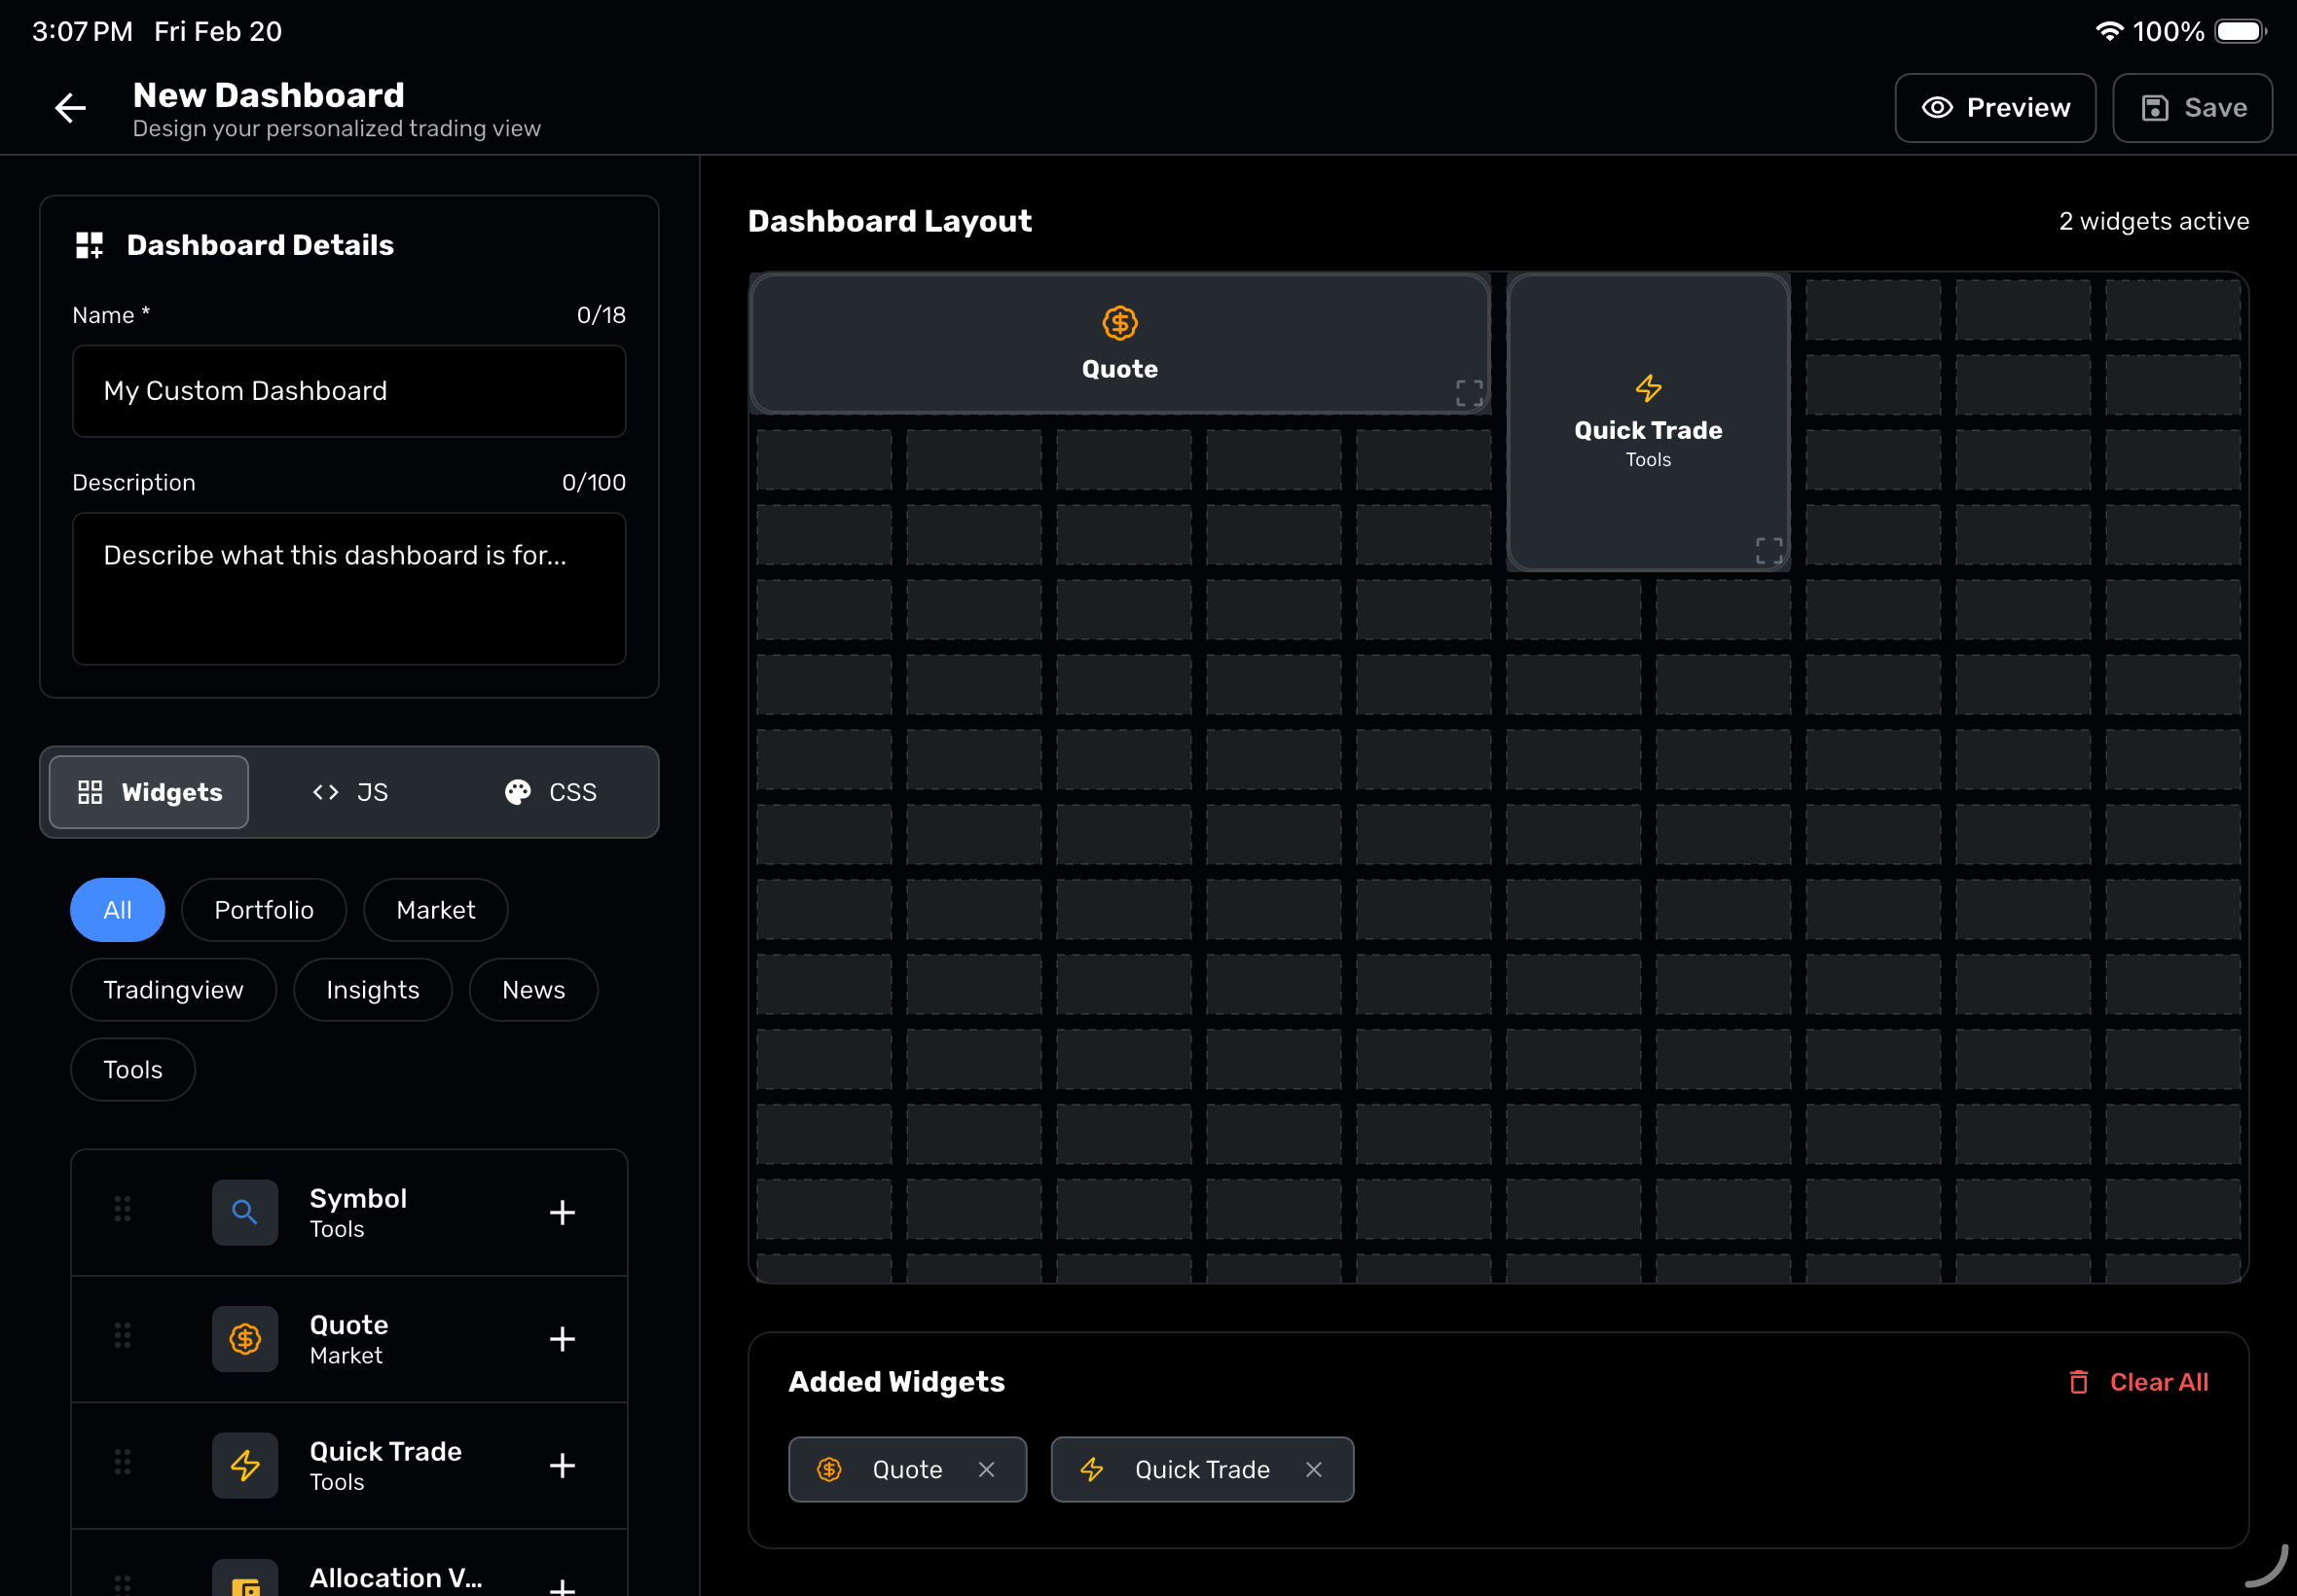
¶ Creating a Custom Dashboard
- Open the Dashboard Library and tap Custom Dashboard.
- Fill in the details:
- Name (required, up to 18 characters)
- Description (optional)
- Drag widgets from the sidebar onto the canvas, or tap the + button next to a widget to add it.
- Resize and reposition widgets on the grid.
- Tap Preview to see your dashboard with live data.
- Tap Save when you are satisfied with the layout.
Your new dashboard will appear as a tab in the main view.
¶ Layout Grid
Dashboards use a grid system that adapts to your screen size:
- Desktop / Web: 10-column grid
- Tablet / Mobile: 12-column grid for finer positioning
Each widget occupies a configurable number of columns (width) and rows (height). Widgets snap to the grid automatically.
¶ Advanced Customization
For power users, the editor includes optional Custom CSS and Custom JavaScript fields. These allow you to style or extend widget behavior beyond the default configuration.
¶ Editing an Existing Custom Dashboard
- Navigate to the custom dashboard you want to edit.
- Tap the Edit button in the top bar.
- The dashboard enters edit mode with a grid overlay:
- Move a widget by dragging it to a new position.
- Resize a widget by dragging the handle in its bottom-right corner.
- Delete a widget by tapping the red X that appears when you select it.
- Tap Done to save your changes.
On mobile, editing tools are accessible via the Tools button, which opens a side drawer with the widget picker.
¶ Layout Settings
Within the dashboard editor, you have additional layout controls:
- Rename Widget — Change the default title of any widget to a custom name.
- Hide Headers — Hide widget header bars to fit more content into a smaller screen, especially useful on phones. Use the Hide Window Headers option.
- Reorder Widgets — Long-press and drag widgets to rearrange their position in the layout.
- Adjust Height — Change the height of individual widgets to allocate more or less space.
¶ Color-Grouped Widgets
Widgets within a dashboard can be grouped together by color. Each color represents a symbol mapping. When you change the symbol on one widget in a color group, all other widgets sharing the same color update automatically.
For example, if the Quote widget is linked to the same color as the Chart and Quick Trade widgets, changing the symbol on the Quote widget will update the Chart and Quick Trade widgets to reflect the same symbol.
This makes it easy to monitor and trade multiple symbols on a single dashboard — each color group operates as an independent symbol context.
¶ Available Widgets
¶ Market
| Widget | Description |
|---|---|
| Quote | Live price, change, and key stats for a symbol. |
| Order Book | Level 2 depth-of-market data. |
| Time & Sales | Real-time trade history with time-stamped prices and sizes. |
| Watchlist | A customizable list of symbols with live quotes. |
| Screeners | Advanced filters to discover stocks by criteria. |
| Market Movers | Top gainers, losers, unusual volume, and most volatile. |
¶ Portfolio
| Widget | Description |
|---|---|
| Positions | Your currently open positions. |
| Orders | Pending and working orders. |
| Transactions | Completed trade history. |
| Gains | Profit and loss summary. |
| Activity | Account activity log. |
| Trades | Signal-based trade entries. |
| Trades News | News related to your active trades. |
¶ News & Information
| Widget | Description |
|---|---|
| News | General market news headlines. |
| Portfolio News | News specific to symbols in your portfolio. |
| Trades Updates | Updates on signal-based trades. |
| Headlines | Top stories across markets. |
| Web | An embedded webpage of your choice. |
¶ Trading Tools
| Widget | Description |
|---|---|
| Symbol | Search and select a trading symbol. |
| Quick Trade | Rapid order entry with pre-set quantities and action buttons (BUY LMT, SELL LMT, etc.). Supports exchange selection and time-in-force options. |
| Custom Buttons | Create personalized hotbuttons for frequent trade actions. Configure each button with a custom title, trade instruction (buy/sell), symbol type, quantity, and offset pricing. Keyboard shortcuts (hotkeys) can also be assigned. |
| Gridbot | Grid trading automation controls. |
| Gridbot List | View and manage active grid bots. |
| Journal | Your trading journal for notes and reflections. |
| Auto Trades | Automated trade signal execution. |
¶ Charts & Analysis (TradingView)
| Widget | Description |
|---|---|
| Chart | Standard candlestick chart. |
| Advanced Chart | Full-featured charting with indicators and drawing tools. |
| Mini Chart | Compact chart for quick reference. |
| Technical Analysis | Oscillators, moving averages, and trend indicators. |
| Fundamental Data | Financial statements and key ratios. |
| Company Profile | Business description, sector, and key metrics. |
| Symbol Info | At-a-glance symbol details. |
| Symbol Overview | Price summary with mini chart. |
| Ticker Tape | Scrolling market ticker. |
| Market Overview | Broad market summary across sectors. |
| Stock Heatmap | Visual sector/stock performance map. |
| Crypto Heatmap | Visual crypto performance map. |
| ETF Heatmap | Visual ETF performance map. |
| Forex Heatmap | Visual forex pair performance map. |
| Economic Calendar | Upcoming economic events and releases. |
| Forex Cross Rates | Currency pair comparison table. |
| Crypto Market | Crypto market overview. |
| Screener | TradingView stock screener. |
| Crypto Screener | TradingView crypto screener. |
| Market Summary | Key market indices and performance. |
¶ Insights & Analytics
| Widget | Description |
|---|---|
| Allocation Value | Portfolio allocation breakdown. |
| Value % | Pie chart of position values. |
| Cost % | Pie chart of position costs. |
| Sector Distribution | Holdings grouped by sector. |
| Cost | Absolute cost basis for positions. |
| Unrealized P/L % | Percentage-based unrealized gains and losses. |
| Reward Ratio | Risk-to-reward analysis. |
¶ Special
| Widget | Description |
|---|---|
| Tabbed Group | A container that holds multiple widgets as tabs within a single dashboard space. Useful for combining Positions, Transactions, Gains, and Orders into one panel. |
Some widgets can be further customized by tapping the three-dot menu on the top-right corner of the widget. For example, the Custom Buttons widget allows you to configure each hotbutton along with its associated keys and actions.
¶ Changing Symbols
Many widgets respond to a shared symbol context. To change the symbol displayed across your dashboard:
- Tap the Config Card (search icon) on the dashboard.
- Search for and select a new symbol.
- All linked widgets in the same color group update to reflect the new symbol.
Stock dashboards default to AAPL and crypto dashboards default to BTC/USDT, but you can change these at any time.
¶ Import & Export
¶ Exporting a Dashboard
- Open the Dashboard Library.
- Tap the menu on the dashboard you want to export.
- Select Export.
- A JSON file is saved to your device's downloads folder.
¶ Importing a Dashboard
- Open the Dashboard Library.
- Tap Import.
- Select a previously exported JSON file.
- The dashboard is added to your library. If a dashboard with the same name already exists, a unique name is generated automatically.
This is useful for sharing dashboard layouts with other TradeGrub users or backing up your configurations.
¶ Cloud Sync
Dashboard configurations are automatically saved to the cloud. Any changes you make — adding widgets, rearranging layouts, or creating new dashboards — are synced in real time and accessible from any device where you sign in with your account.
¶ Dashboard Visibility
You can control which dashboards appear in your main tab bar without deleting them:
- In the Dashboard Library, tap the star icon on any dashboard to toggle its visibility.
- Visible dashboards appear as tabs. Hidden dashboards remain in the library and can be re-enabled at any time.
¶ Desktop vs. Mobile
| Feature | Desktop / Web | Mobile |
|---|---|---|
| Grid columns | 10 | 12 |
| Widget picker | Sidebar (always visible) | Drawer (tap "Tools") |
| Widget editing | Hover to reveal delete/resize | Tap to select, then interact |
| Tab navigation | All tabs visible | Scrollable tabs |
| Drag and drop | Mouse-based | Touch-based |
| TradingView embeds | Fully interactive | Fully interactive |
¶ Tips
- Start with preloaded dashboards and duplicate them before making changes. This preserves the originals.
- Use color groups to link related widgets (Quote + Chart + Quick Trade) so they all follow the same symbol.
- Use Tabbed Groups to save space by combining related widgets (e.g., Positions + Orders + Transactions) into a single panel.
- Hide widget headers on smaller screens to maximize the visible data area.
- Mini Charts are great for the Overview dashboard — add several side by side to monitor multiple symbols at a glance.
- Quick Trade paired with Order Book and Chart creates an efficient scalping layout.
- Set up Custom Buttons with keyboard shortcuts for your most frequent order types to speed up trade execution.
- Export your dashboards periodically as a backup. You can re-import them if needed.