¶ Positions
¶ Description:
The View Positions module allows traders to monitor their open trading positions in real-time. It provides insights into the instrument, size, entry price, current price, day and total gain, percentage, and unrealized P&L, offering a snapshot of the trader’s active portfolio. The module supports both grid and table views, with options to filter, rearrange, and customize headers to match the trader's preferences.
¶ Key Features:
-
Grid and Table View: View open positions in different formats to suit your needs.
-
Real-Time Price Monitoring: Track price movements and market changes in real-time.
-
Day and Total P/L Tracking: Monitor daily and total profit/loss, including percentage changes.
-
Close Positions Directly: Execute closures from within the module.
-
Customizable Columns: Filter, rearrange, and enable/disable columns.
-
Open Order Indicator: See which positions have active orders.
-
Quick Account Information: Check key details like buying power, equity, P/L (day and total), cost, and value.
-
Market Index Movements: View daily market index movements to track trends and performance.
¶ Positions Overview:
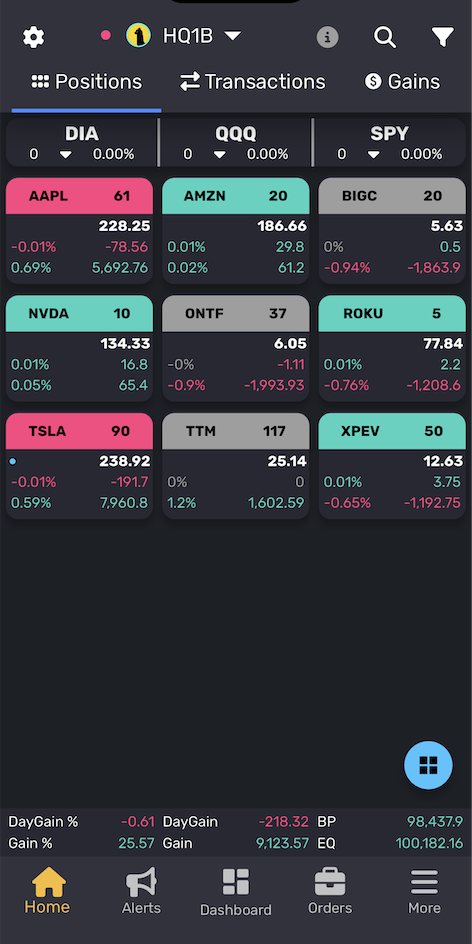
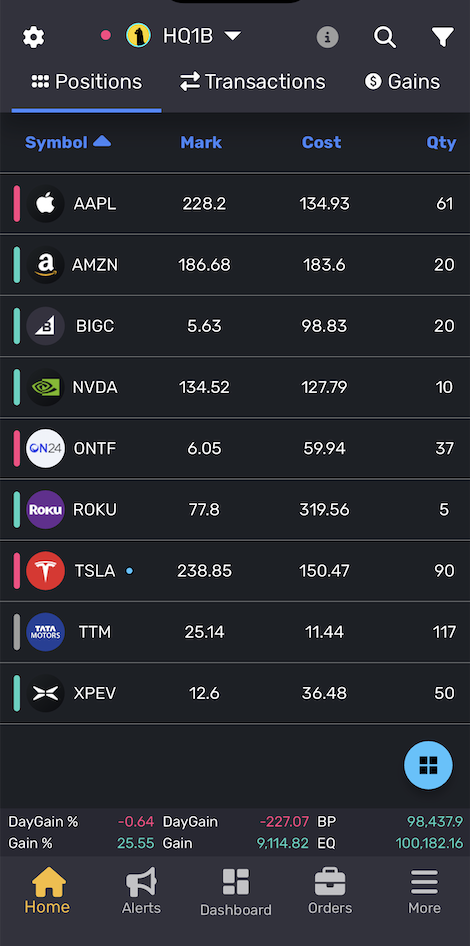
Displays the current portfolio in grid mode (default) or table mode. Users can switch modes and enable/disable headers using the blue button at the bottom right of the screen.
- Account Selection: Use the drop-down at the top left to switch between different accounts.
- Account Status:
- Green Dot: Account is connected.
- Red Dot: Account is disconnected.
- Long Press on Account: Forces a reconnection to the exchange.
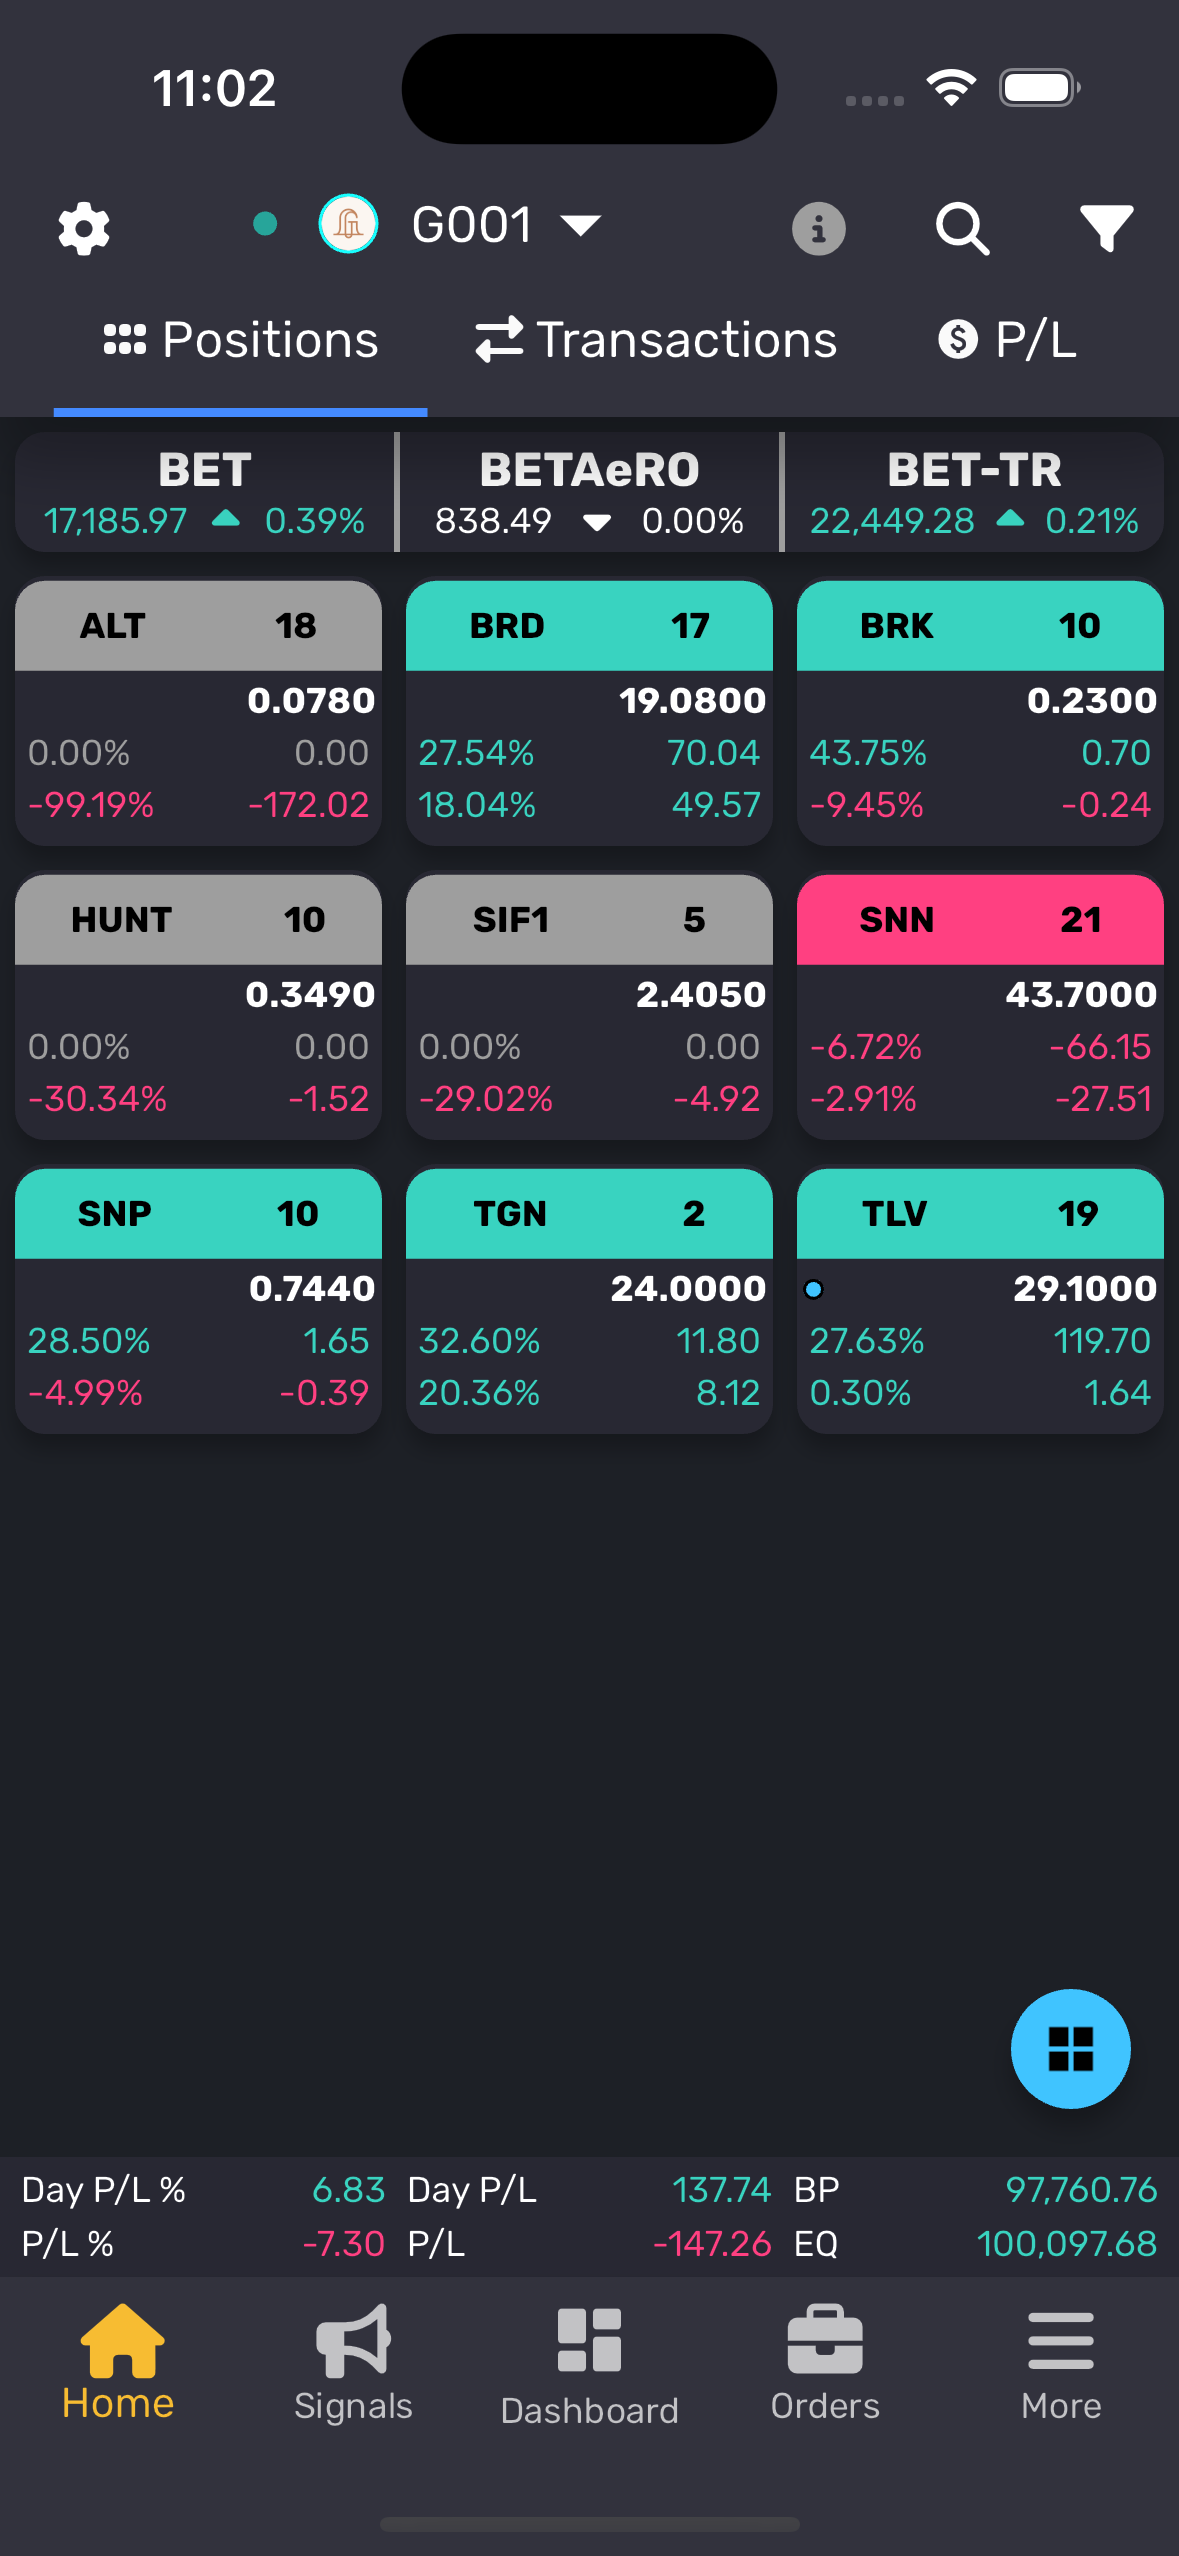
¶ Grid Mode (Default):
- Header:
- Left: Symbol
- Right: Quantity
- Row 1: Order Indicator (Left) | Mark Price (Right)
- Row 2: Day Gain % (Left) | Day Gain (Right)
- Row 3: Gain % (Left) | Gain (Right)
¶ Table Mode (Default):
- Symbol: Name of the symbol.
- Mark: Current market price.
- Cost: Purchase price or current average.
- Qty: Total quantity held.
- Day Gain: Net gain for the current trading day.
- Day Gain %: Percentage gain for the day.
- Gain: Total net gain.
- Gain %: Total percentage gain.
- Value (Optional): Current net value based on the market price.
- Cost (Optional): Total cost based on the purchase price.
¶ Account Quick Info:
Displayed at the bottom of the positions screen:
- Row 1:
- Day Gain % | Day Gain Amount | BP (Buying Power) | Value (Optional total value of all positions)
- Row 2:
- Total Gain % | Total Gain Amount | EQ (Total Account Equity) | Cost (Optional total cost of all positions)
¶ Colors and Indicators:
- Green or Red: Position color indicates a profit or loss.
- Grey: No profit or loss for the position.
- Blue Dot: Active order for the position.
- Long Press on Position: Quick jump to the specific order.
- Green on Bottom Navigation: Indicates a live account.
- Yellow on Bottom Navigation: Indicates a sandbox/paper account.
¶ Settings (Reorder)
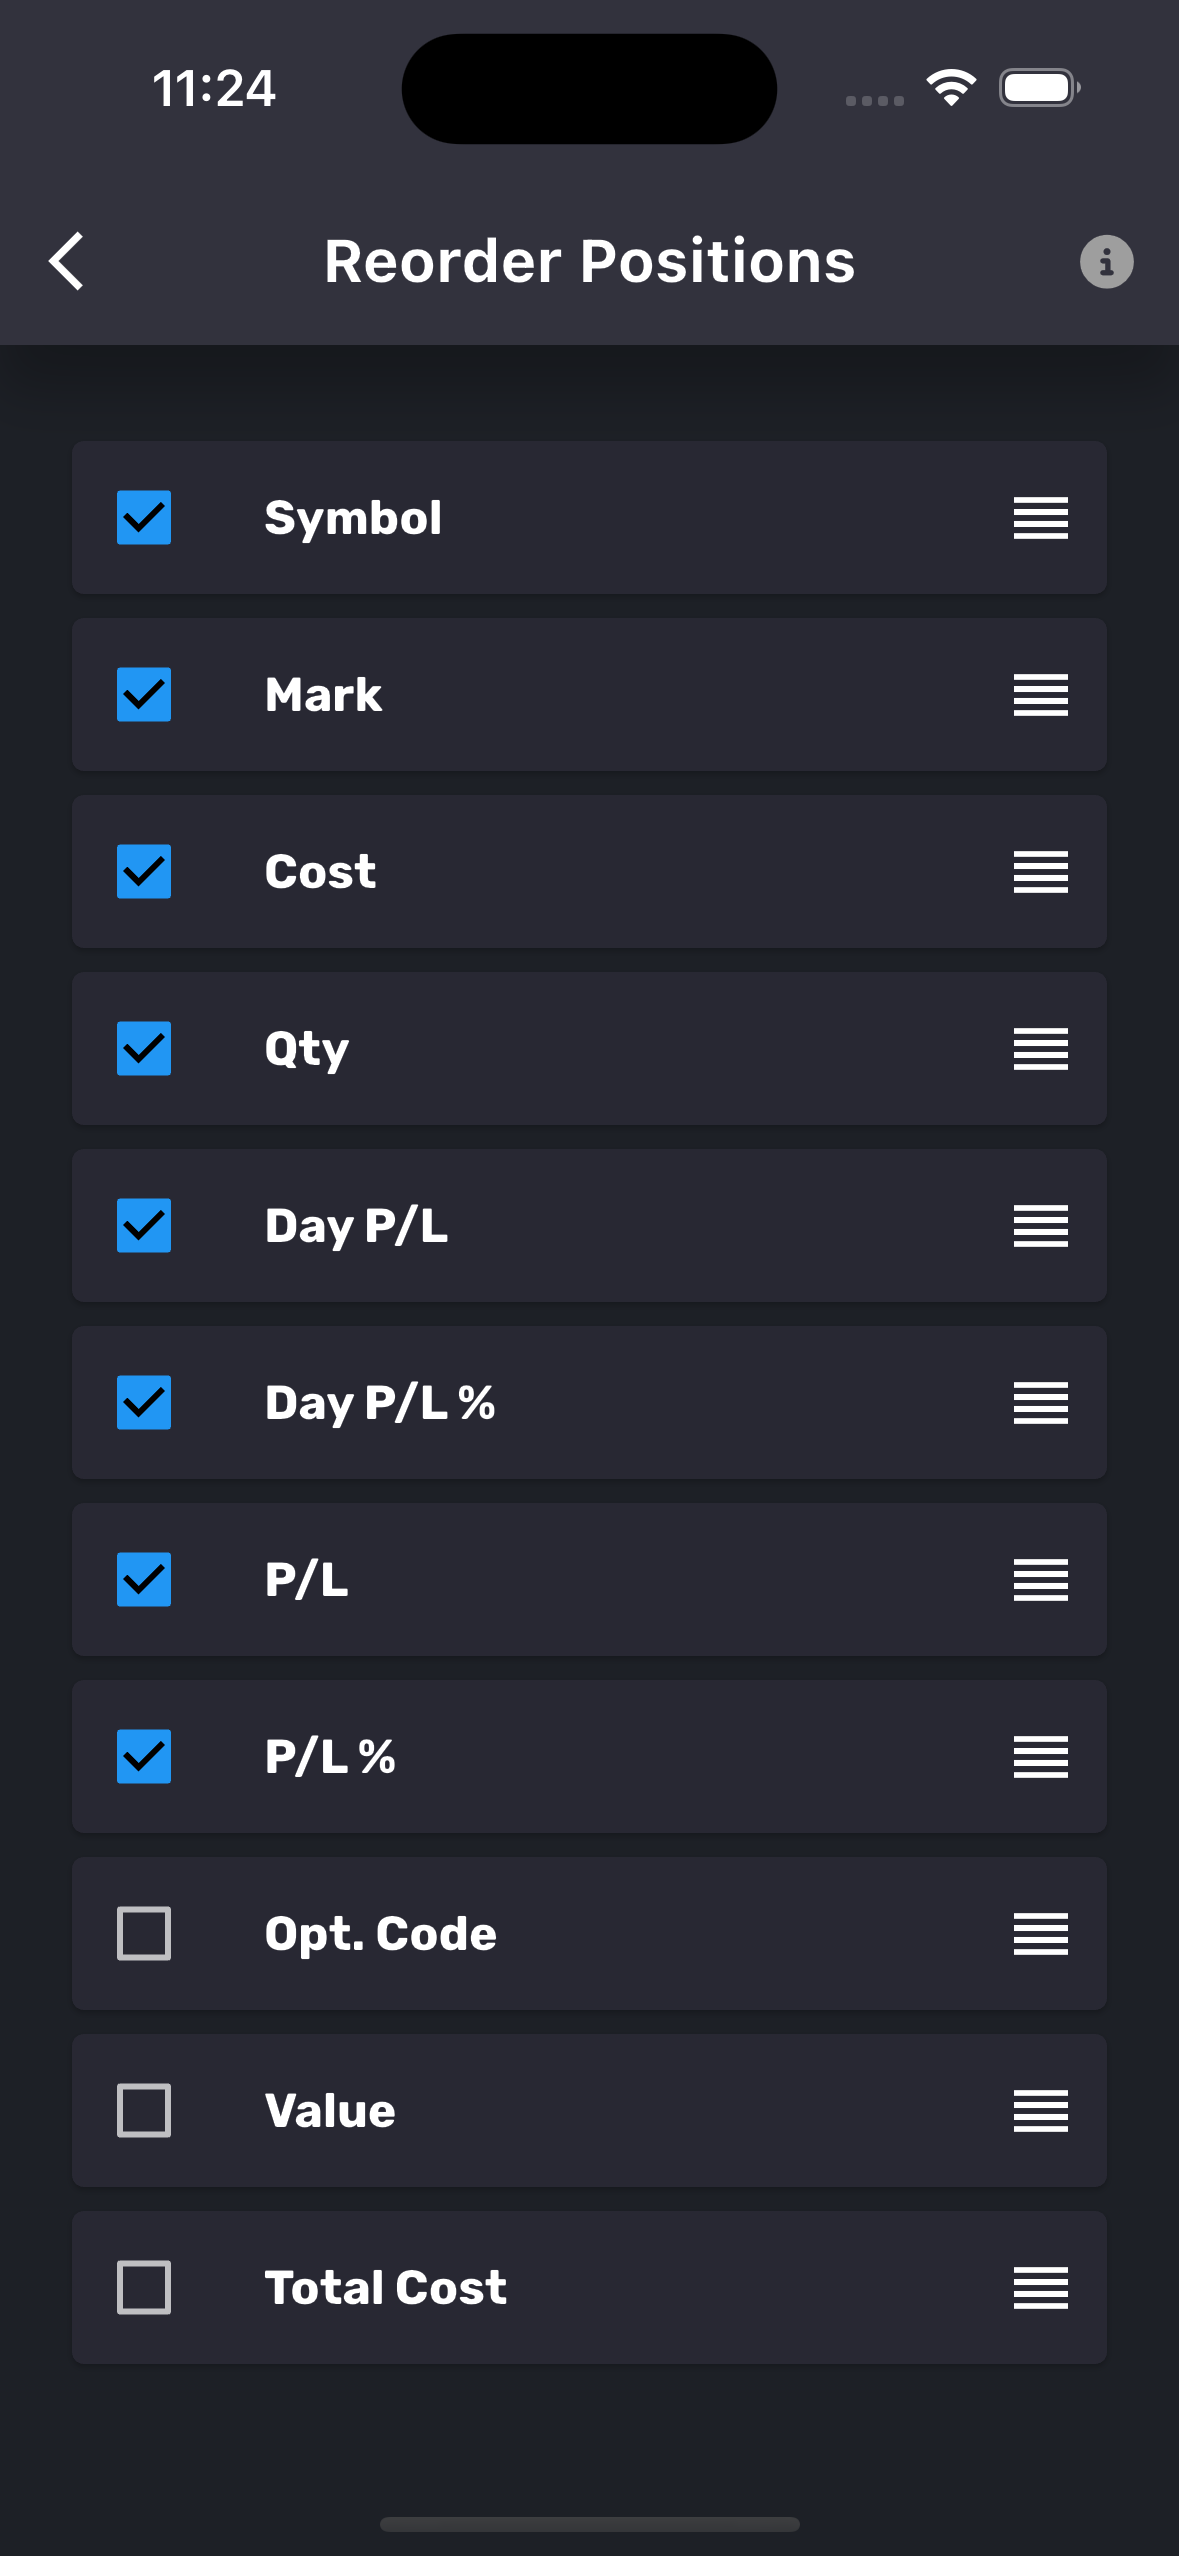
- This setting allows you to adjust the order of columns and also enable or disable specific columns for display.
- Long press and drag/drop a particular column to change the specific order of the column relative to other columns.
¶ Positions, Transactions, P/L Filters
-
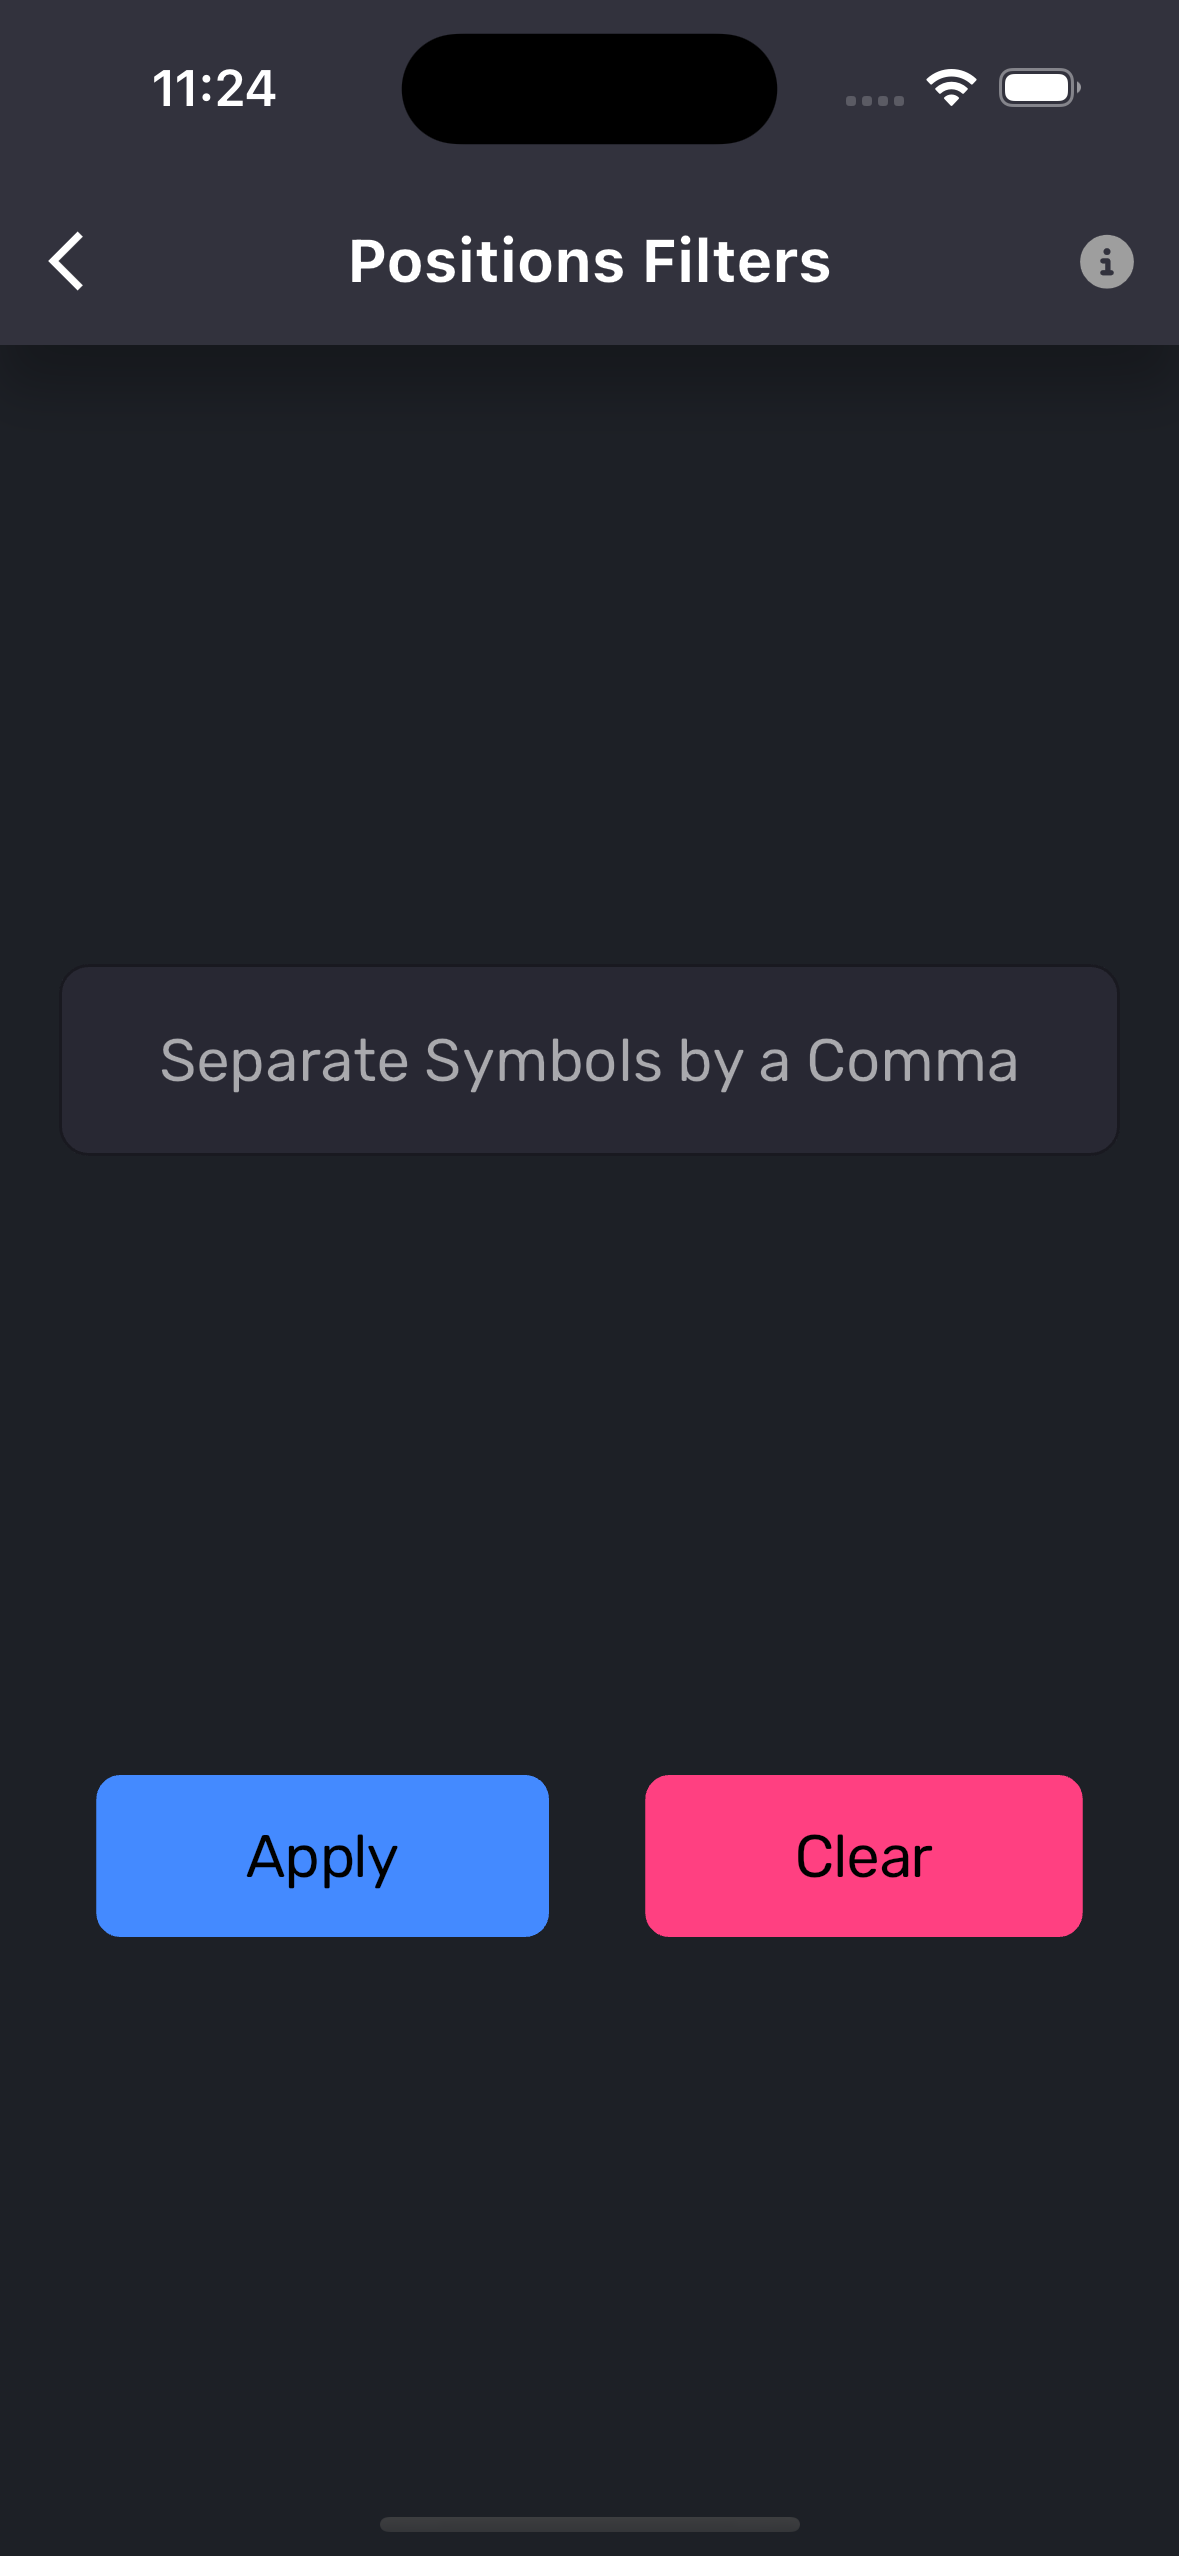
This setting allows you to filter and view specific items only on screen. It is context sensitive filter button so depending on the selected table (and tab), filter settings would change.
-
Specific settings are given below for reference:
-
Separate Symbols by a Comma - Allows you to create a list of symbols and the display would only show records matching those symbols. Example: AAPL, TSLA, FB
- Type of Transaction (Sell, Buy, Int, Div, Wid, Dep, Other) - Applicable for Transactions only. It will allow you to display transactions of types Buy, Sell, Interest, Dividend, Withdrawal, Deposit, and any other type of transaction.
- Days (14, 30, 60, All) - Applicable for Transactions and Gains only. Allows you to load transactions of the last 14, 30, 60, or All days.
- Date Range - Applicable for Transactions and Gains only. Allows you to select date ranges to show specific transactions.
¶ Context Sensitive Help, Settings, Filter
- You can get help for specific tab by pressing info button. It will show tab specific info. Similarly, when you click on settings or filter, then it will show settings and filter for that specific tab.
¶ Screenshot:
¶ Additional Information:
- Customization Options: Use the Settings button at the top left to reorder, enable, or disable specific headers for a personalized view.
- Switching Views: Easily switch between grid and table modes using the button at the bottom right.
- Reconnecting Accounts: Long press on an account to force reconnection if disconnected.
- Comprehensive Market Overview: Stay informed with real-time P/L tracking, open order indicators, and index movements to make quick and informed decisions.
Tip: Use the grid view for a concise summary of positions and the table view for more detailed tracking of individual trade performance.