¶ P/L (Profit and Loss)
¶ Description:
The P/L (Profit and Loss) module provides insights into the trader’s overall performance by tracking both realized and unrealized gains and losses. Traders can analyze how individual trades and their portfolios perform over time and adjust strategies accordingly. The module offers comprehensive tracking with customizable views, making it easy to identify profitable trades and areas of improvement.
¶ Key Features:
- Real-Time and End-of-Day Tracking: Monitor realized profits and losses throughout the trading day.
- Detailed Breakdown by Asset or Trading Pair: View P/L grouped by individual symbols or trading pairs.
- Historical Data and Filtering: Analyze performance over specific periods to identify trends and patterns.
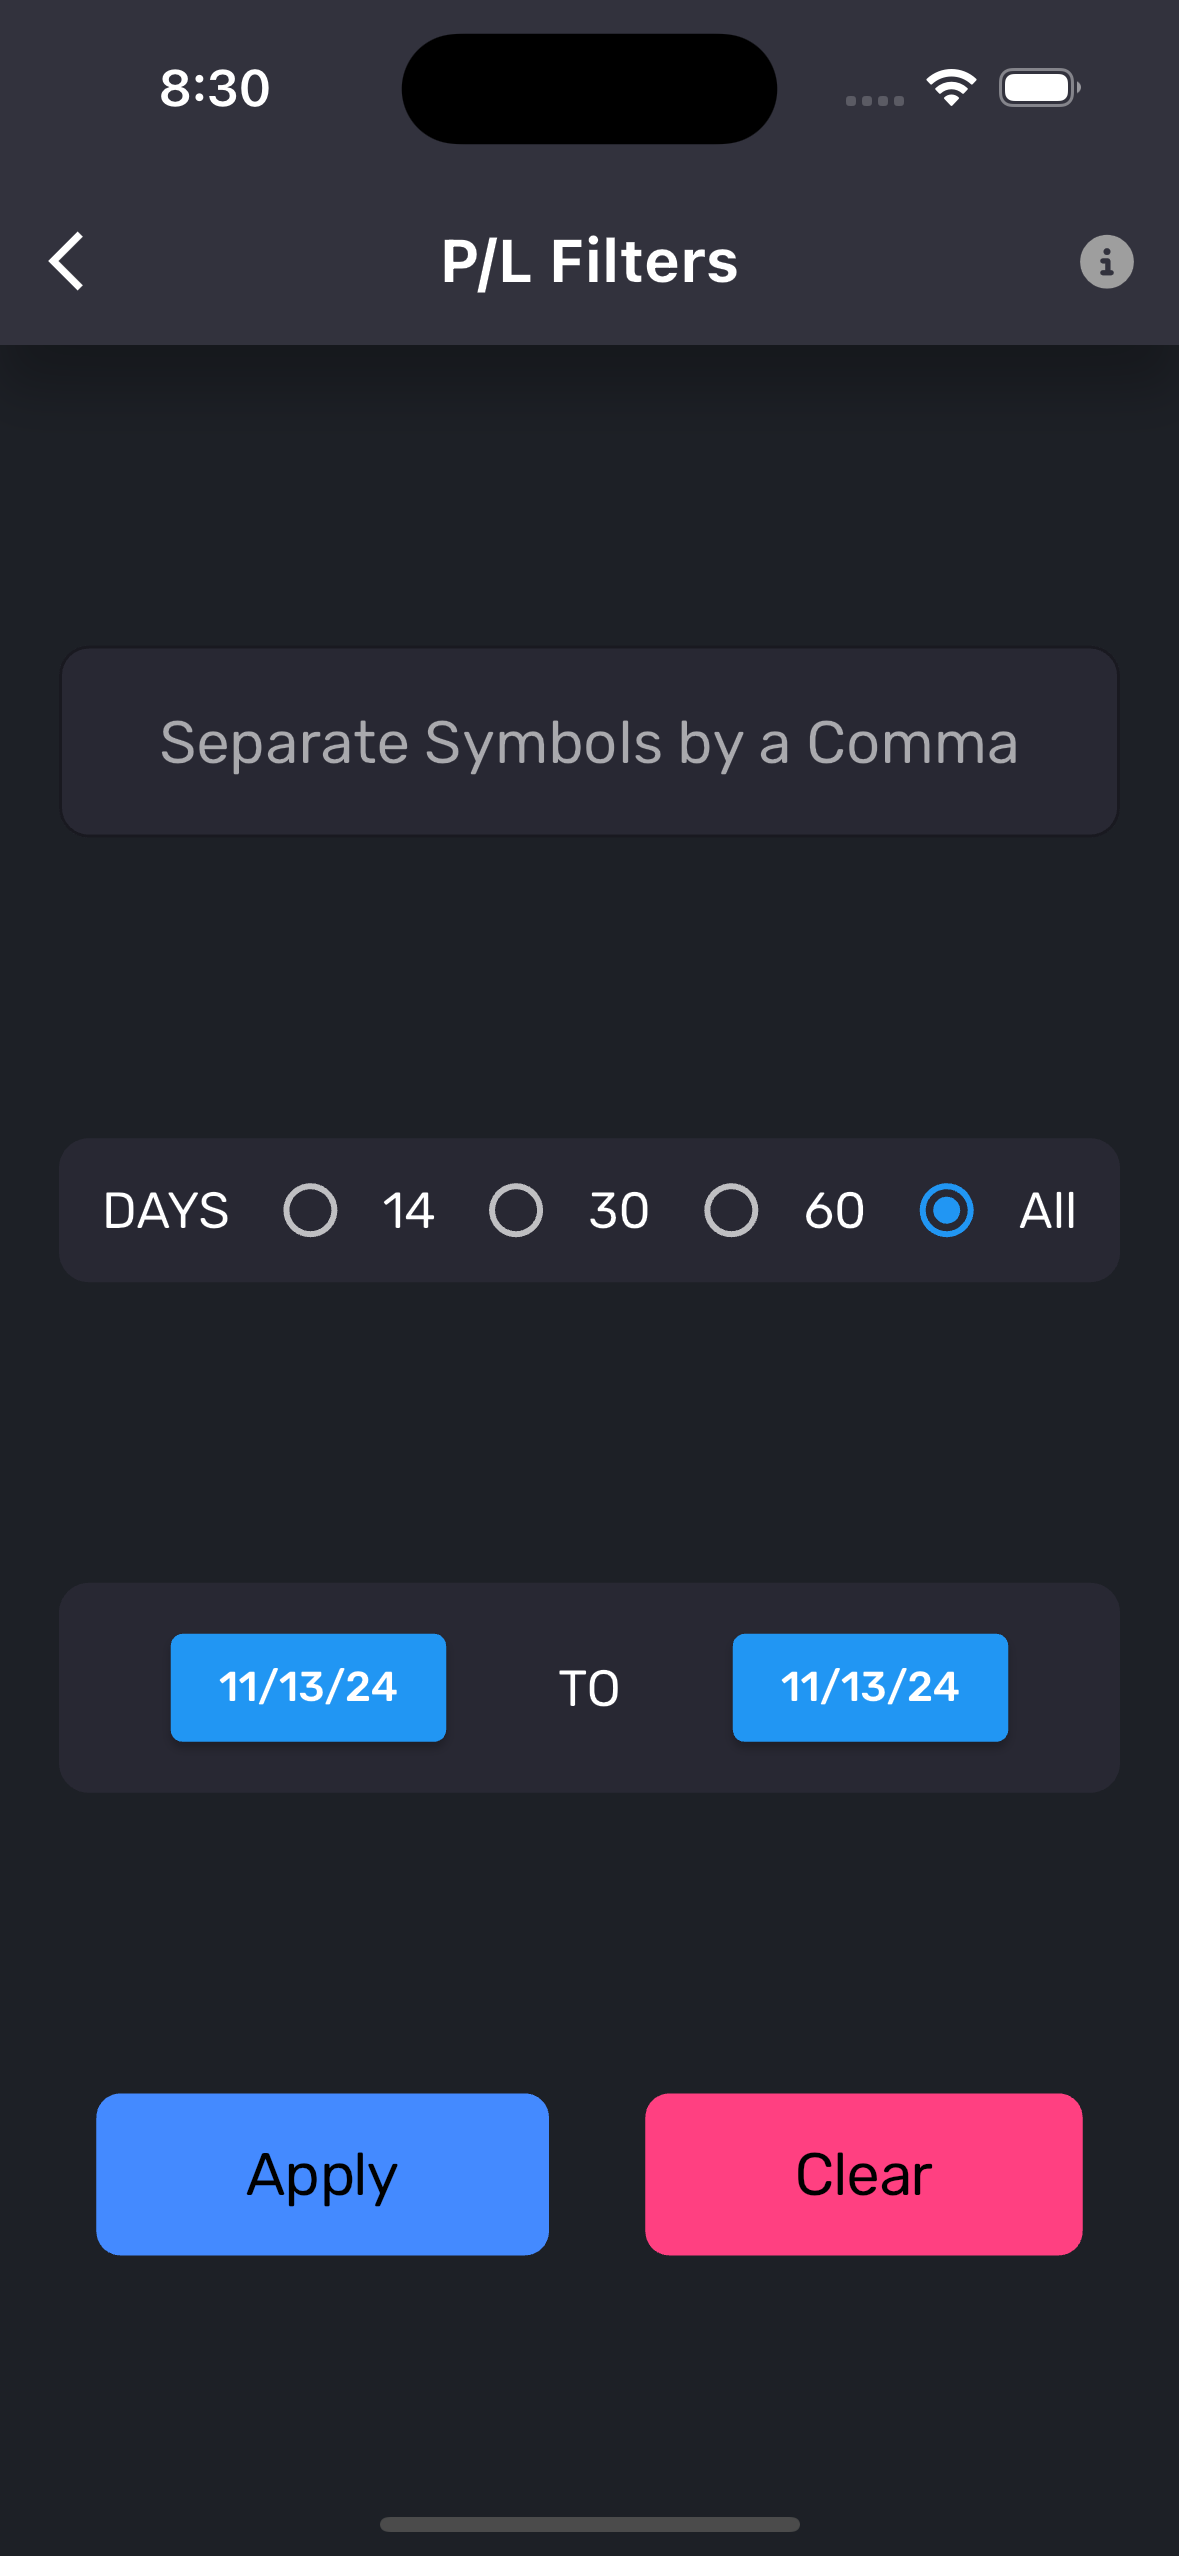
- Flexible Filters: Filter results by time range or symbols, helping traders focus on the most relevant data.

¶ Profit and Loss:
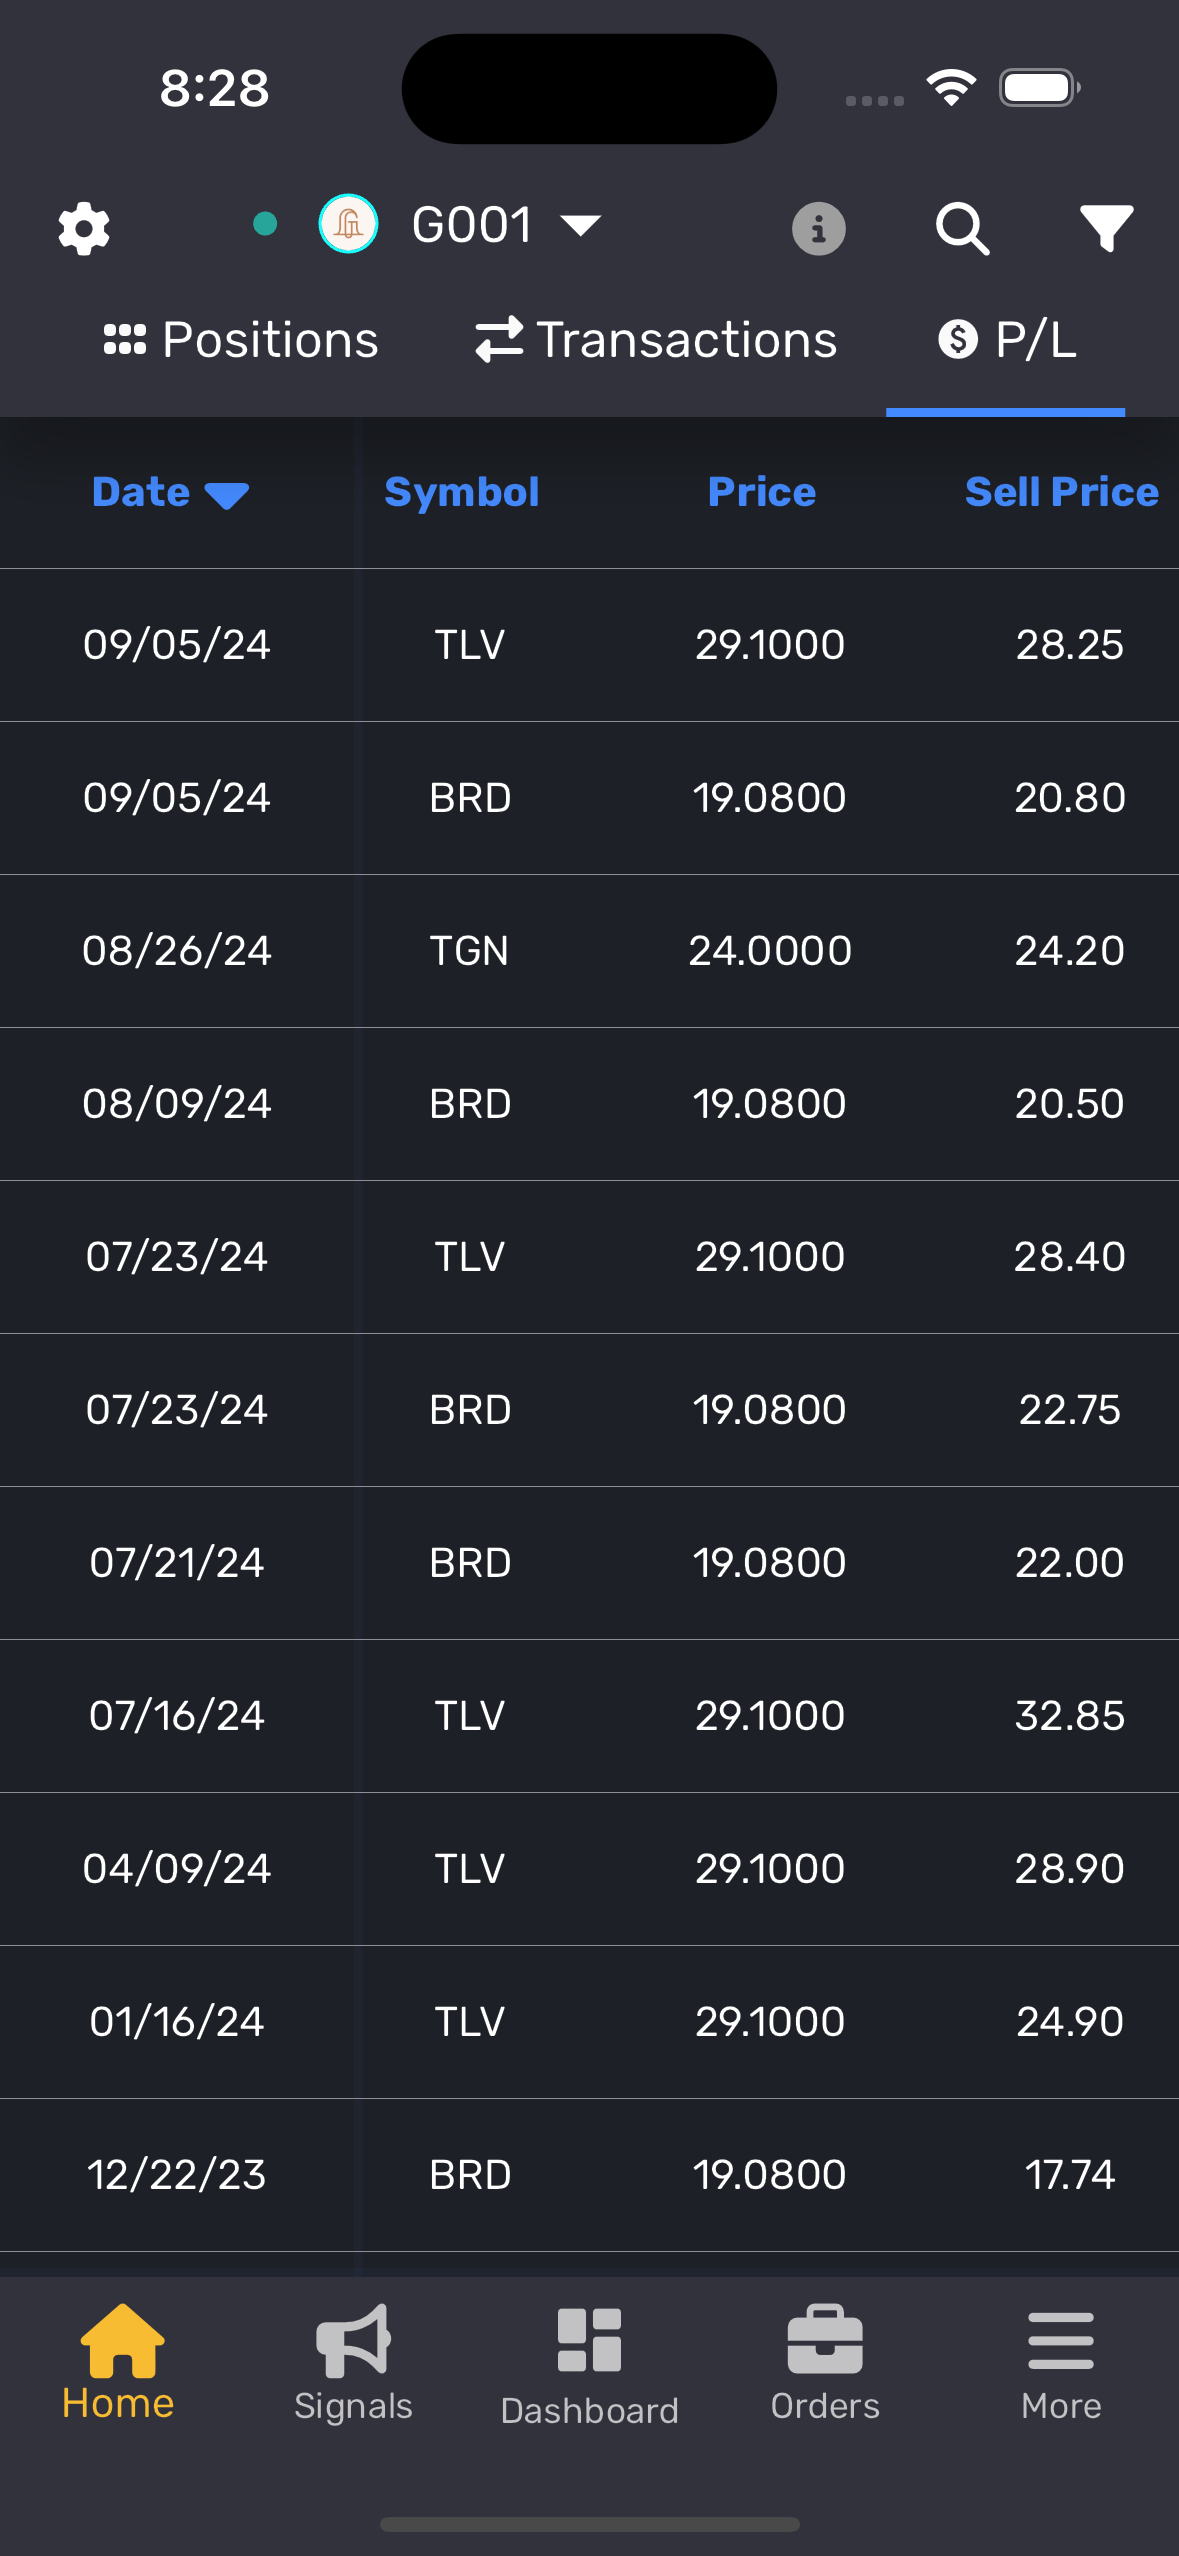
The Profit and Loss section provides a quick overview of recent profits or loss, displaying P/L for the last 60 days by default. This view helps traders track short-term performance and trends.
¶ Key Features:
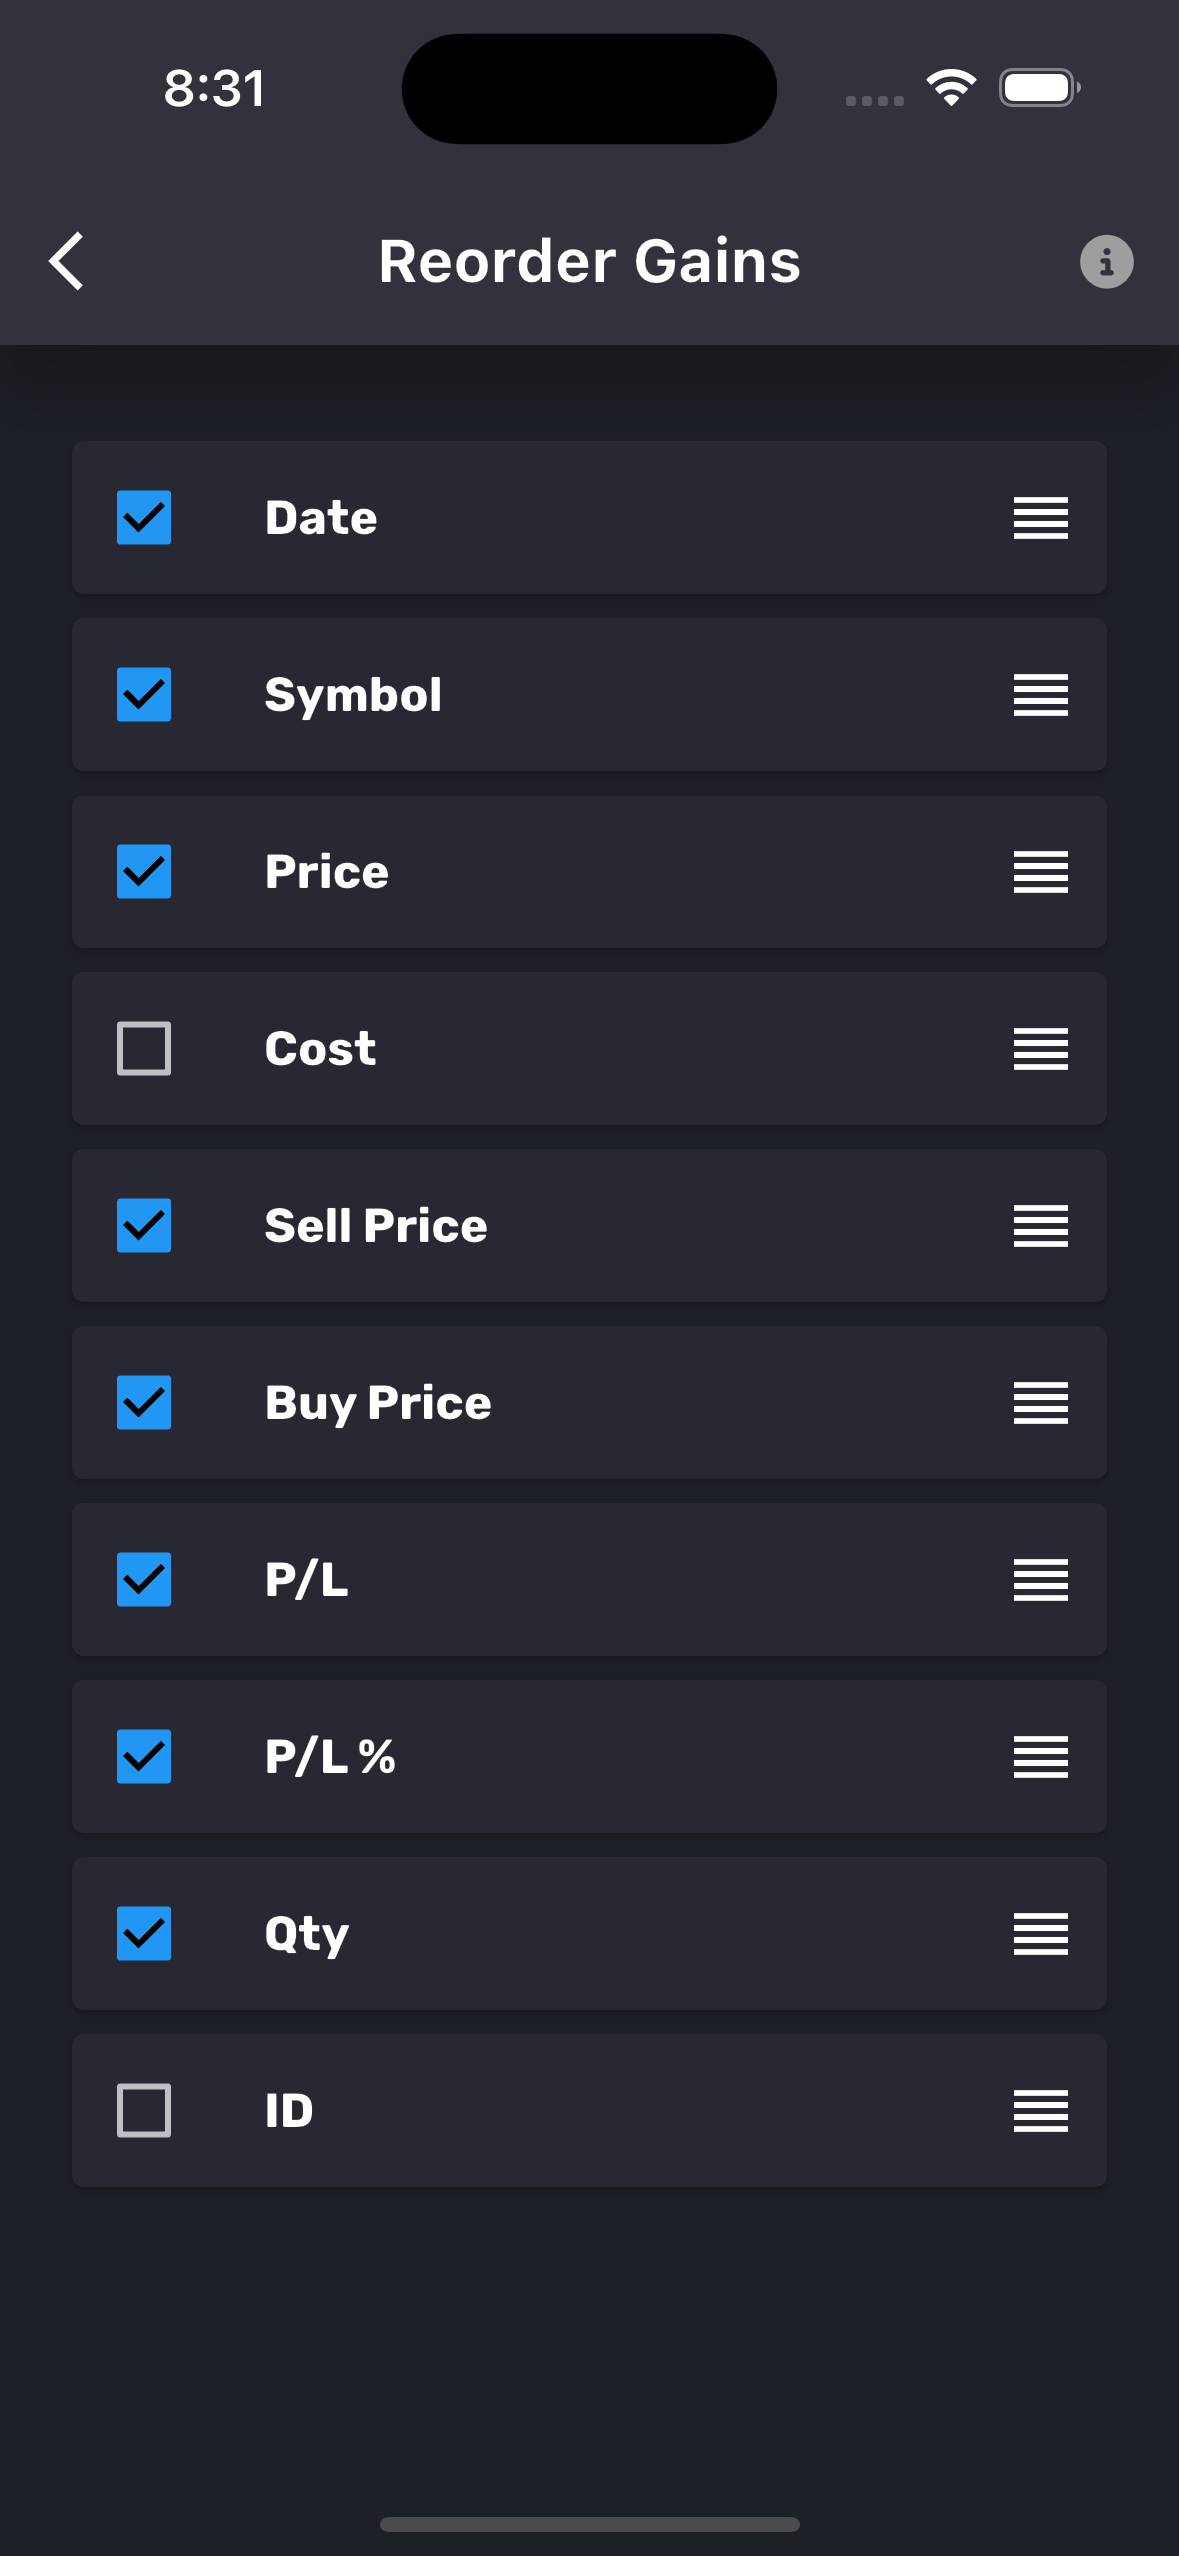
- Customizable Headers: Click on Settings to reorder or enable/disable specific columns for a tailored view.
- Interactive Sorting: Click on any header to sort the data based on the selected column (e.g., Date, Gain %).


¶ Profit and Loss (Default View):
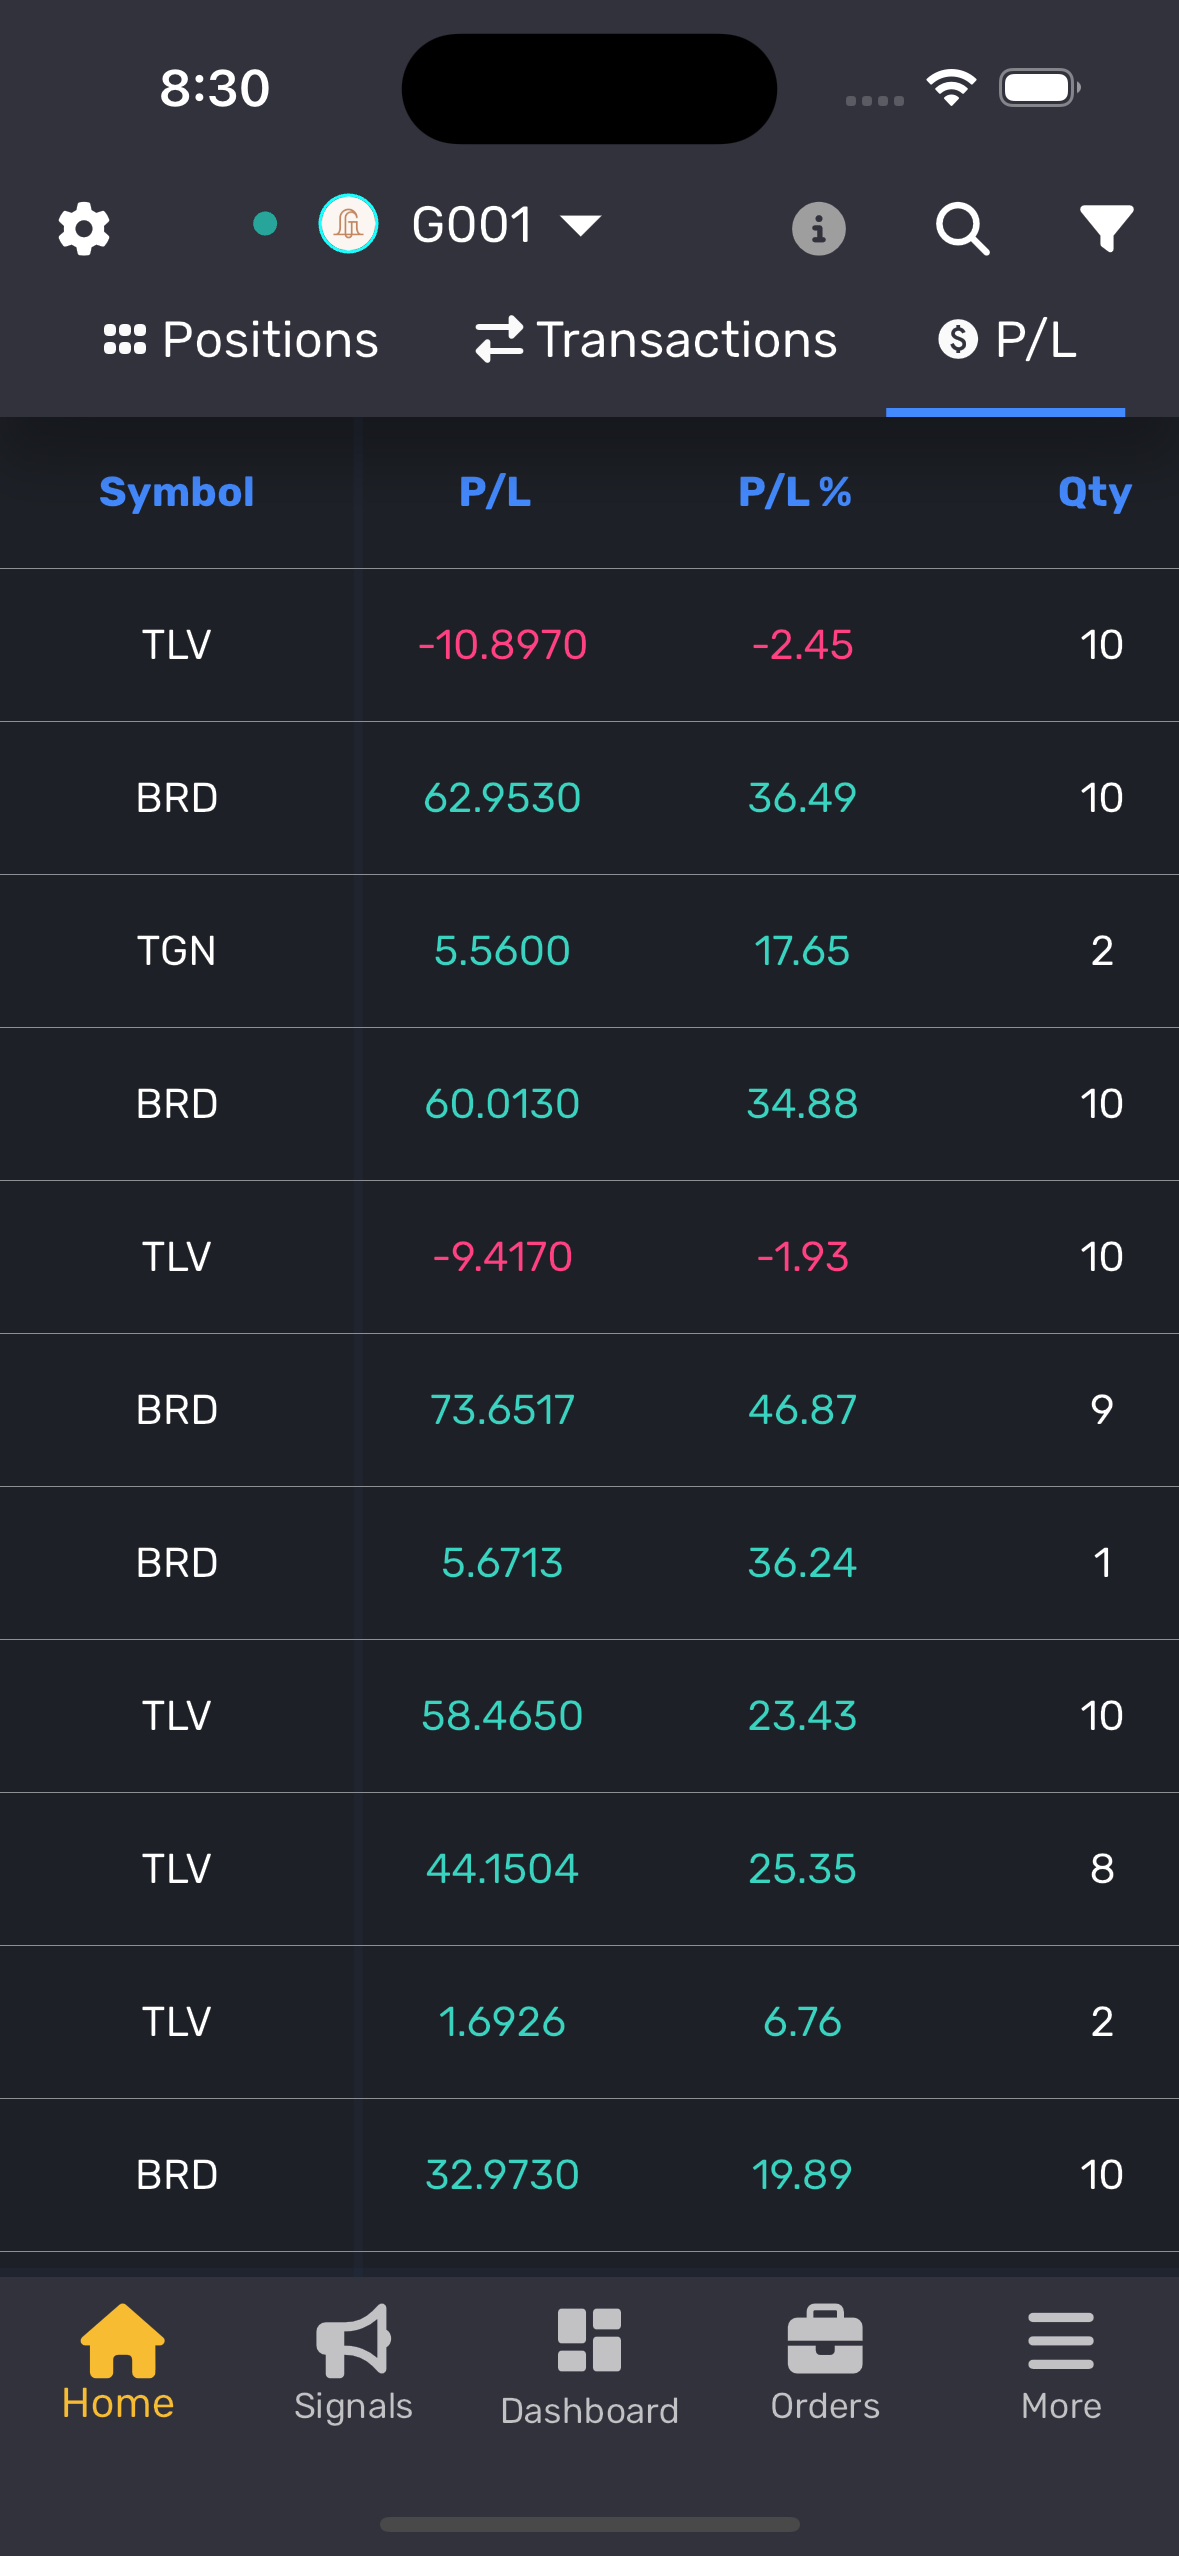
- Date: The date when the gain was recorded.
- Symbol: The name of the traded symbol.
- Price: The current price of the symbol (delayed quote).
- Sell Price: Price at which the asset was sold.
- Buy Price: Price at which the asset was purchased.
- Gain: The net profit or loss from the trade.
- Gain %: Percentage increase or decrease from the purchase price.
- Qty: Total quantity traded.
- ID (Optional): Last transaction ID for reference.

Tip: Use the Profit and Loss to monitor recent profits/loss and quickly identify winning strategies. Customize the headers to focus on the most critical metrics, ensuring you stay on top of market movements and performance trends.