¶ Screeners
The Screeners module helps you discover trading opportunities in real time. It offers 7 predefined screeners for quick market scans and a Visual Builder for creating fully custom filters using SQL-style logic. All results are displayed in a sortable, searchable table with customizable columns.
¶ Two Modes
The screeners screen has two tabs:
| Tab | Purpose |
|---|---|
| Predefined | One-tap access to built-in screeners and saved user-defined screeners |
| Custom | Build your own screener with flexible WHERE/AND filter clauses (Visual Builder) |
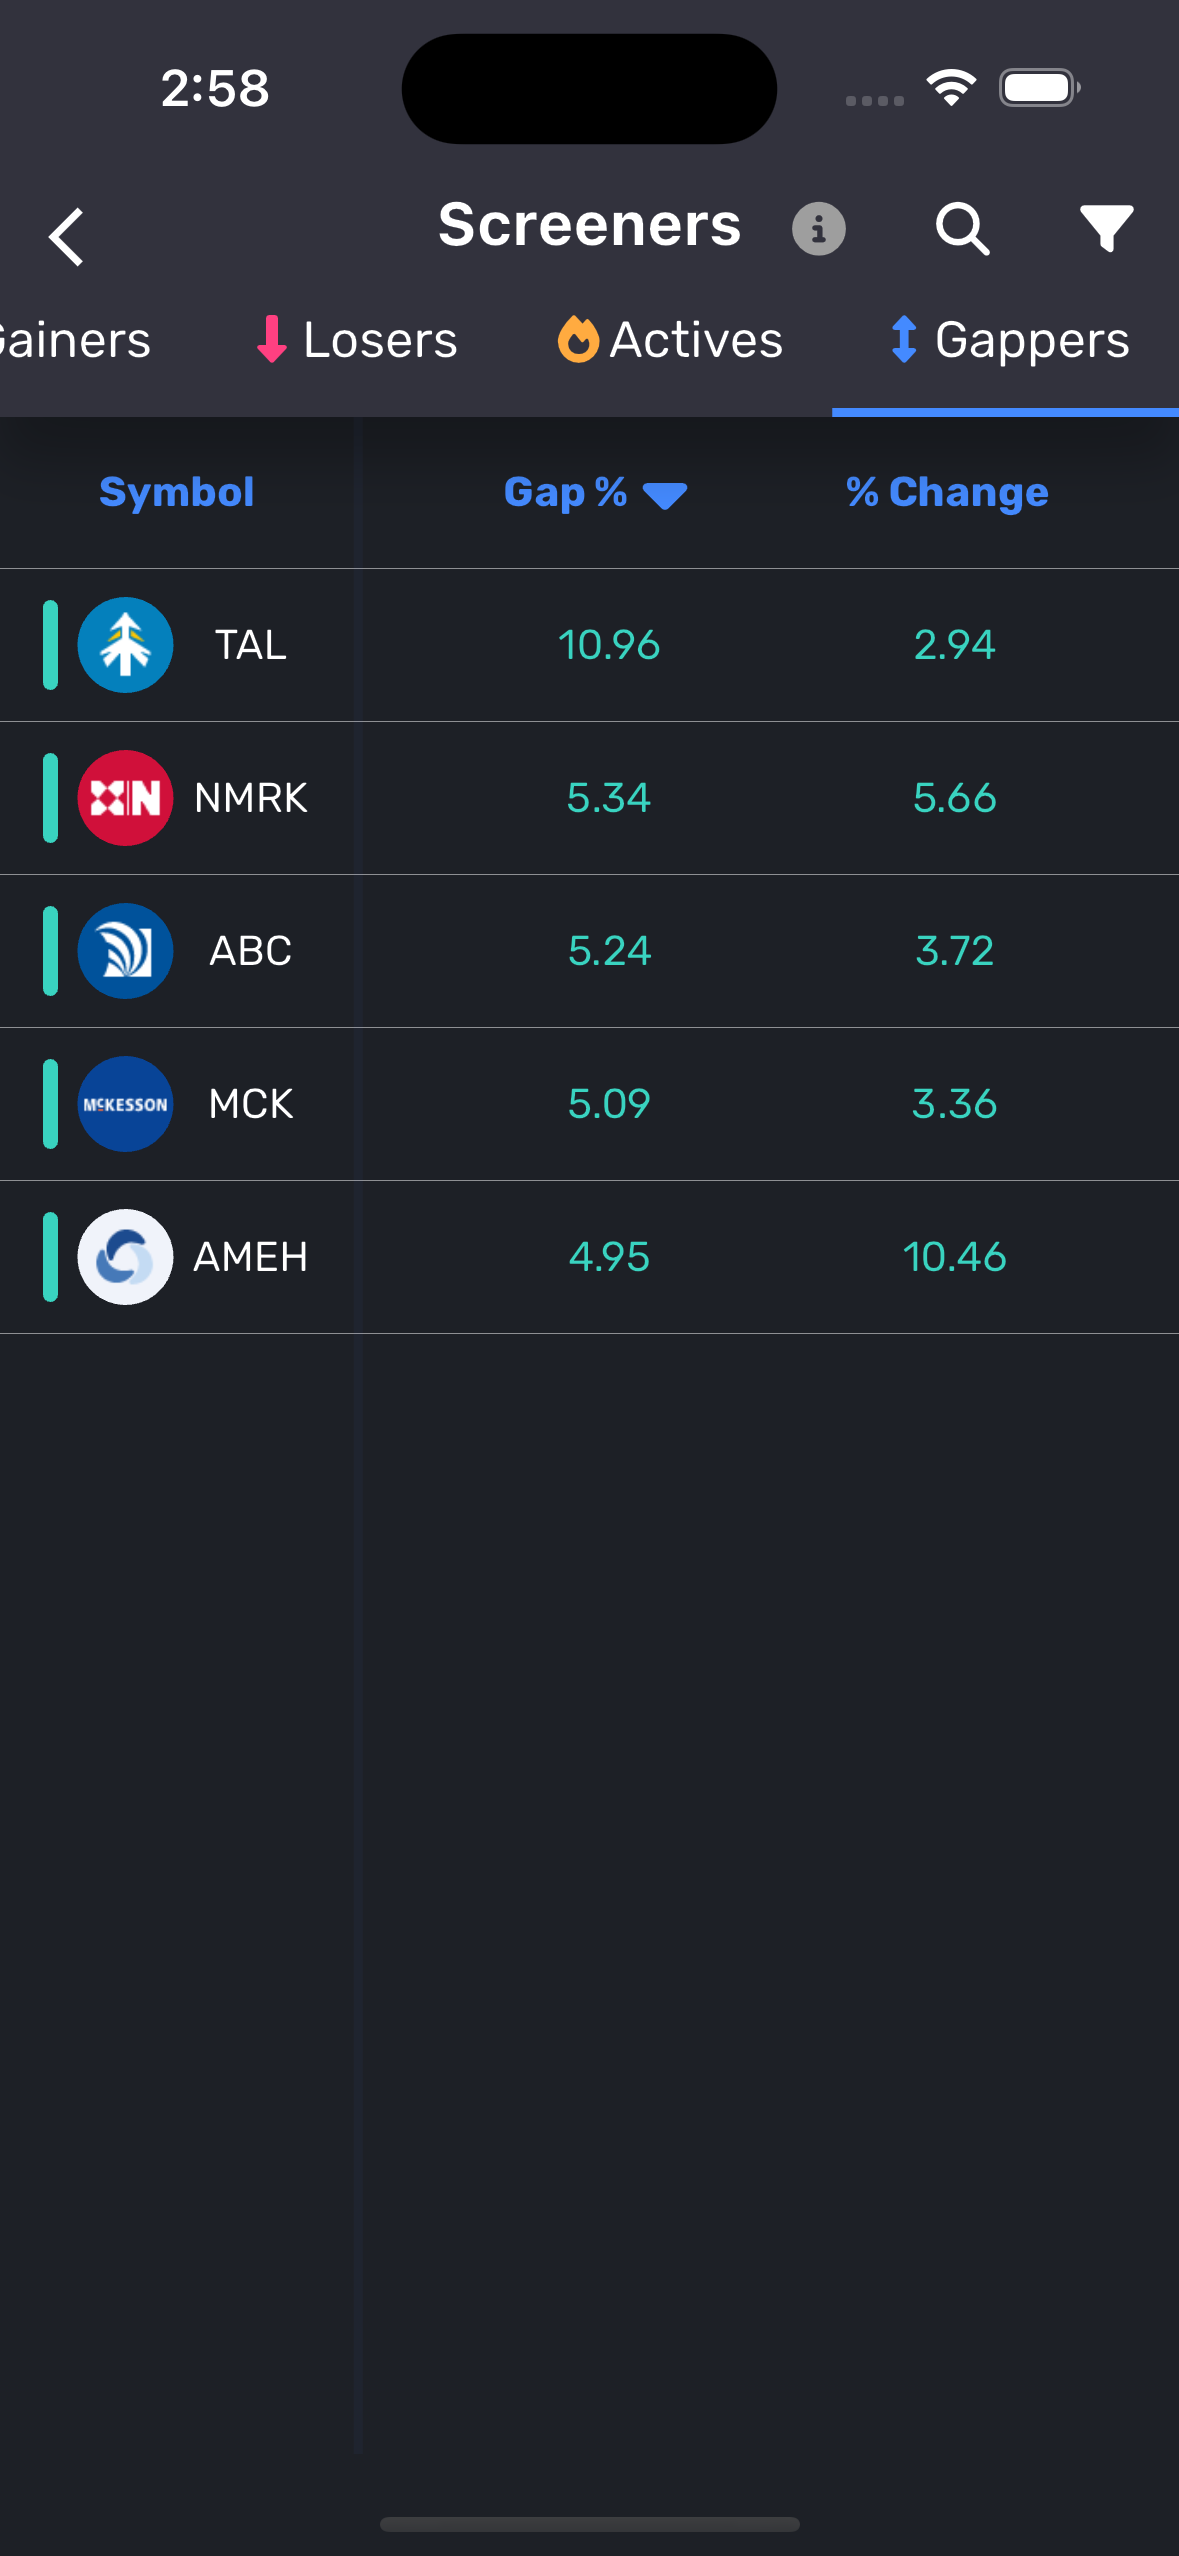
¶ Predefined Screeners
Select from seven built-in screeners designed for common trading scenarios:
| Screener | What It Finds | Default Sort |
|---|---|---|
| Top Gainers | Stocks up more than 5% today | Change % (highest first) |
| Top Losers | Stocks down more than 5% today | Change % (lowest first) |
| Unusual Volume | Stocks with volume above 1M | Volume (highest first) |
| Momentum Plays | Stocks with change above 2% | Change % (highest first) |
| Undervalued | Stocks with P/E ratio below 15 | P/E (lowest first) |
| High Dividend | Stocks with P/E ratio below 25 | Market Cap (largest first) |
| New 52W Highs | Stocks at their 52-week high | 52W High (highest first) |
Tap any screener card to instantly load its results. The card shows the match count when selected.
¶ Visual Builder (Custom Tab)
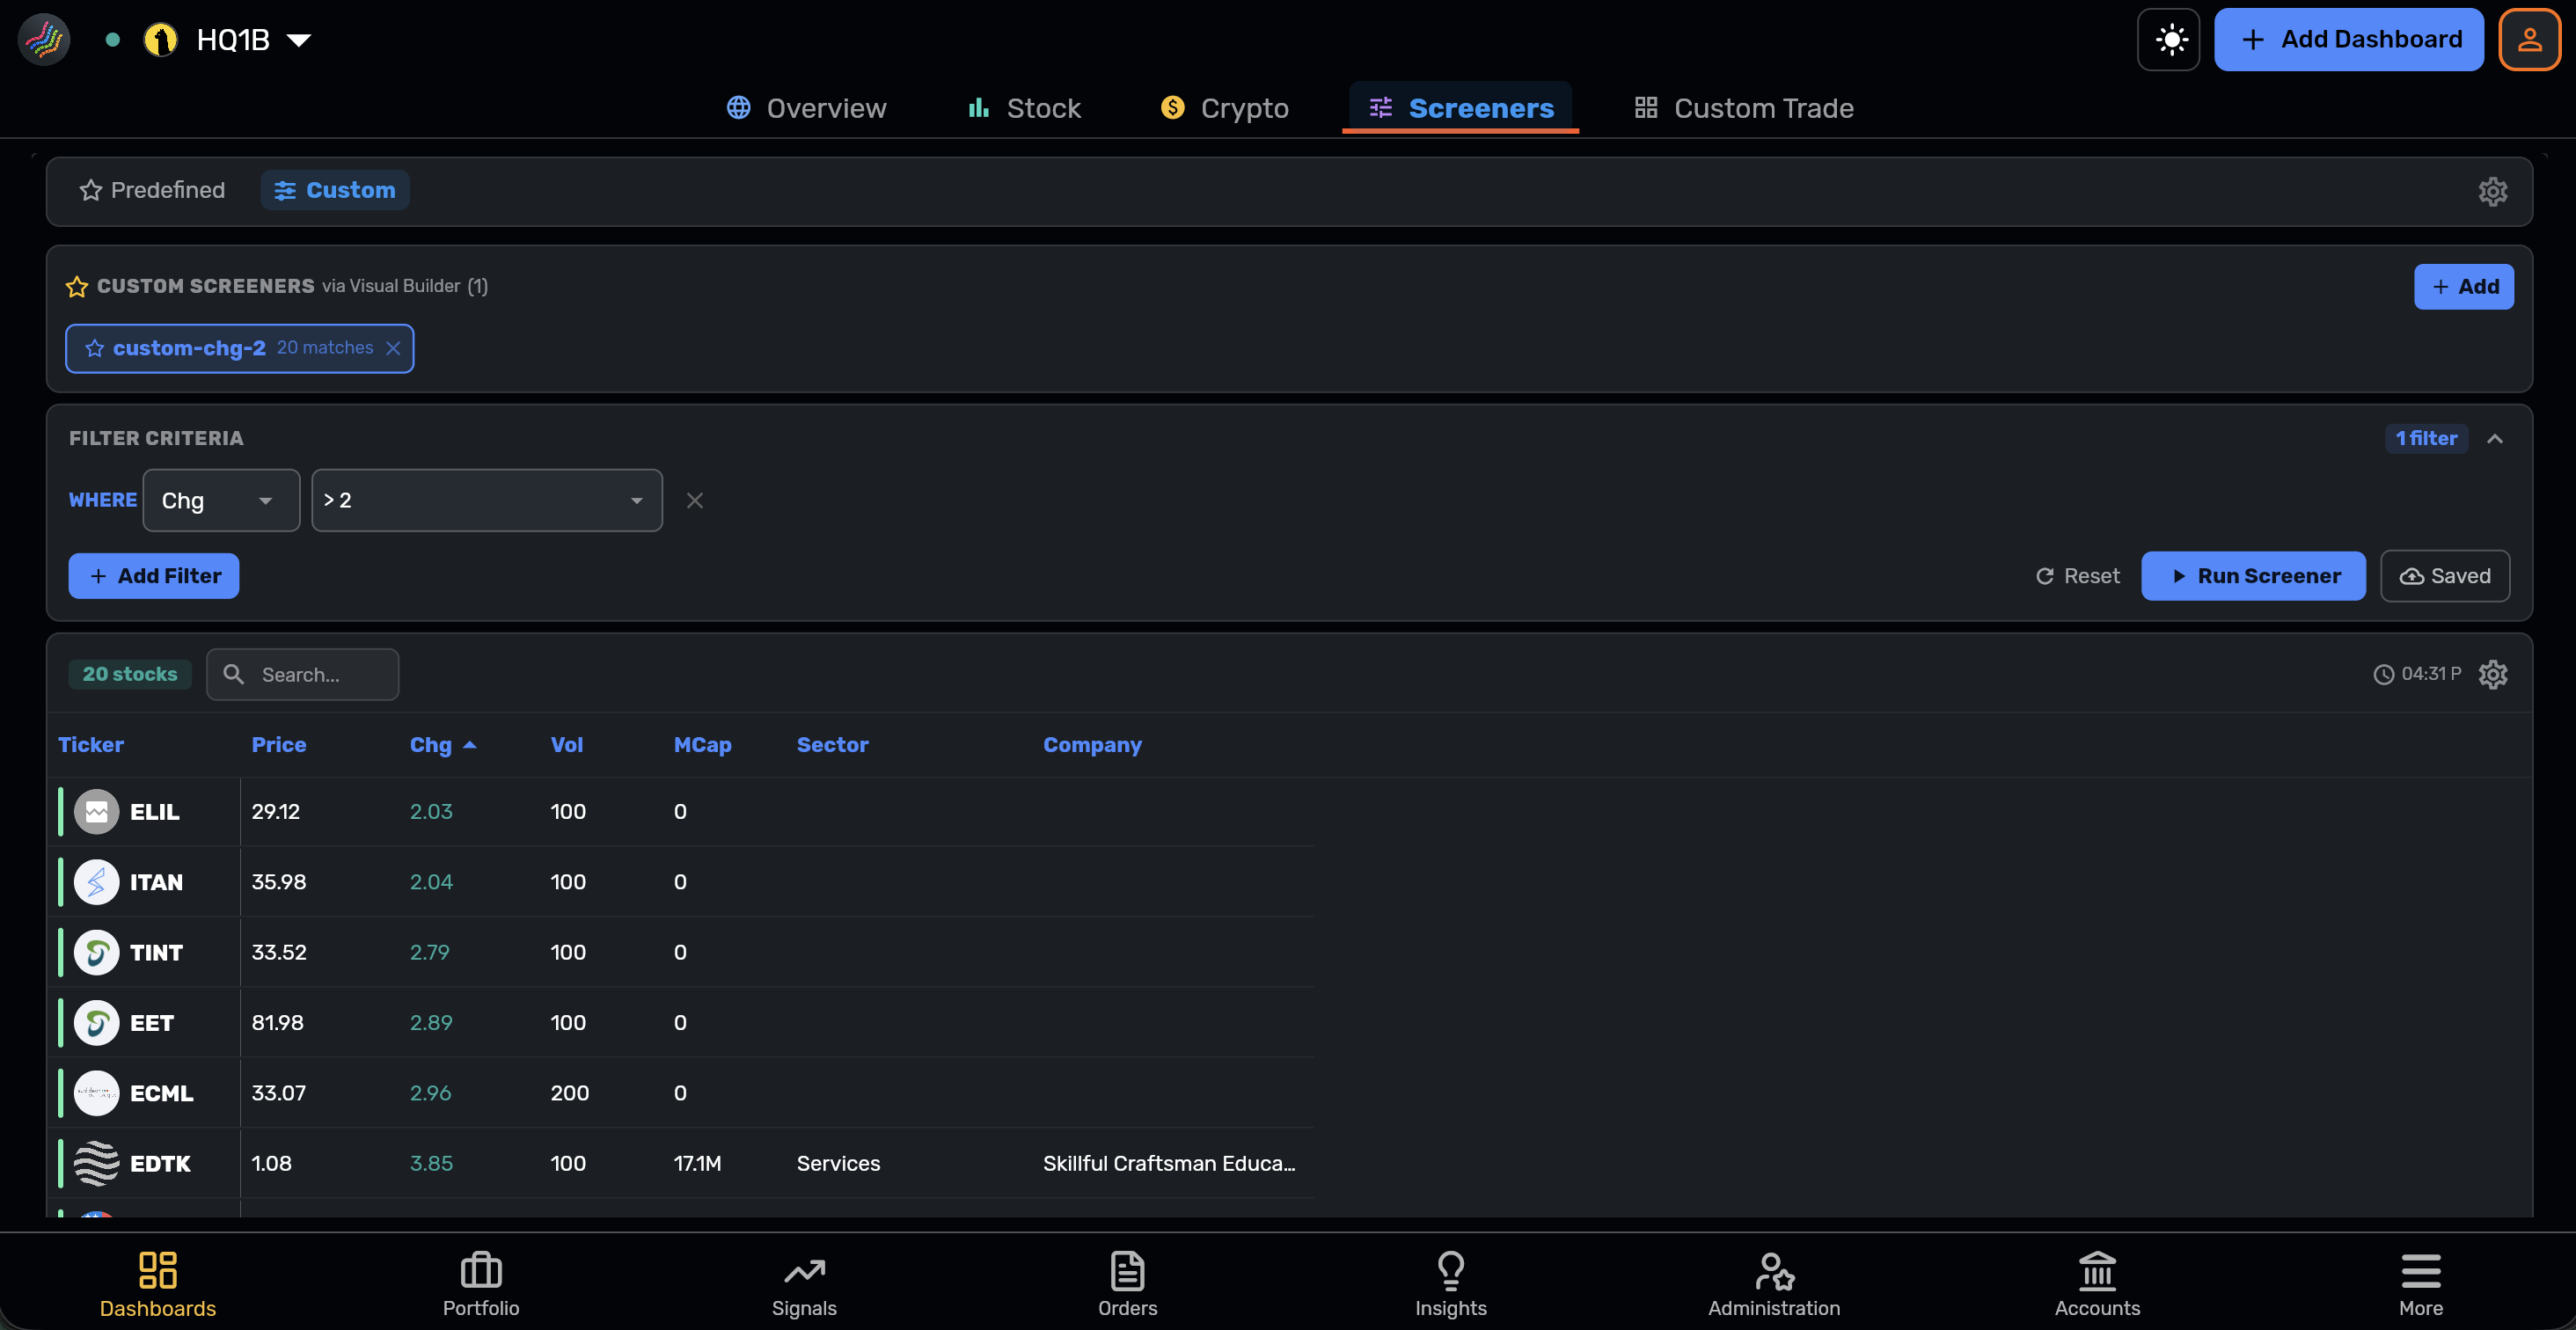
Build advanced filters using SQL-style logic. Each filter clause follows a WHERE / AND pattern:
WHERE  [Field]  [Operator]  [Value]
AND    [Field]  [Operator]  [Value]
AND    ...
¶ Available Fields
| Category | Fields |
|---|---|
| Price | Price, Open, High, Low, Last, Bid, Ask, 52W High, 52W Low |
| Volume | Volume, Bid Volume, Ask Volume |
| Fundamentals | Market Cap, P/E Ratio |
| Performance | Change % |
¶ Operators
| Symbol | Meaning |
|---|---|
>= |
Greater than or equal to |
<= |
Less than or equal to |
> |
Greater than |
< |
Less than |
= |
Equal to |
¶ Quick-Select Presets
When setting a value, common presets are available depending on the field:
- Price fields — Above 100, 10 to 100, 10 and below, 5 and below
- Volume fields — Low (< 100K), Medium (100K - 1M), High (1M - 10M), Very High (> 10M)
- Market Cap — Micro (< 300M), Small (300M - 2B), Mid (2B - 10B), Large (10B - 200B), Mega (> 200B)
- P/E Ratio — Negative (< 0), Low (< 10), Moderate (10 - 20), High (20 - 50), Very High (> 50)
- Change % — Big Loss (< -5%), Loss (-5% to 0%), Flat (0%), Gain (0% to 5%), Big Gain (> 5%)
You can also type a custom value directly. Shorthand notation is supported: 10B, 500M, 100K.
¶ Saving Custom Screeners
¶ From the Visual Builder
- Build your filter clauses and tap Run Screener to verify results.
- Tap Save as Custom to name and save your screener.
- Saved screeners appear in the Custom Screeners section at the top.
- Tap a saved screener to reload its filters and results instantly.
- Modify filters and tap Update to save changes to an existing screener.
- Tap the X on a saved screener to delete it.
¶ From the Predefined Tab
- Tap the + icon in the Custom Screeners section.
- Name your screener and set filter ranges using sliders for Volume, High, Low, Open, Close, and more.
- Choose a sorting field (any column) and order (Ascending / Descending).
- Tap Apply to save and activate, or Clear to reset.
¶ Results Table
The results table displays matched stocks with the following features:
- Match count badge — Shows the number of stocks matching your criteria.
- Search — Filter results by ticker symbol or company name.
- Timestamp — Shows when results were last updated.
- Sortable columns — Tap any column header to sort.
¶ Default Columns
Price, Change %, Volume, Market Cap, Sector, Company Name
¶ All Available Columns
Ticker, Company, Price, Change, Volume, Market Cap, P/E Ratio, Sector, High, Low, Open, Last, Bid, Ask, Bid Volume, Ask Volume, 52W High, 52W Low
¶ Column Customization
Tap the gear icon in the results header to open the column selector:
- Check/uncheck columns to show or hide them.
- Drag to reorder columns using the handle on the right.
- Changes apply immediately when you navigate back.
¶ Auto-Refresh
Tap the gear icon in the tab bar to configure automatic data refresh:
| Option | Behavior |
|---|---|
| None | Manual refresh only (default) |
| 5 min | Refreshes results every 5 minutes |
| 15 min | Refreshes results every 15 minutes |
Auto-refresh pauses automatically when the app is in the background to conserve resources, and resumes when you return to the screeners screen. An orange dot appears on the gear icon when auto-refresh is active.
¶ How to Use
- Open Screeners from the navigation menu or More section.
- Choose a tab — Predefined for quick scans, Custom for advanced filtering.
- Select or build a screener — Tap a predefined card, or add filter clauses in the Visual Builder.
- Review results — Browse the sortable table, search by ticker or name.
- Customize your view — Adjust columns, set auto-refresh, save screeners for reuse.
¶ Example Use Cases
| Scenario | How To |
|---|---|
| Find today's biggest movers | Predefined tab — Top Gainers or Top Losers |
| Spot high-volume breakouts | Visual Builder — WHERE Volume >= 10M AND Change % > 5% |
| Screen for value stocks | Visual Builder — WHERE P/E < 15 AND Market Cap >= 2B |
| Track penny stocks | Visual Builder — WHERE Price <= 5 AND Volume >= 1M |
| Monitor large-cap earnings plays | Visual Builder — WHERE Market Cap >= 10B AND Change % >= 2% |
| Daily morning scan | Save a custom screener + set auto-refresh to 5 min |
¶ Summary
The Screeners module combines ready-made market scans with a powerful Visual Builder, giving you both speed and flexibility. Predefined screeners provide instant insights into gainers, losers, volume spikes, and momentum. The Visual Builder lets you construct precise multi-condition filters with preset shortcuts and shorthand input. Save your custom screeners for one-tap reuse, customize table columns to focus on what matters, and set auto-refresh to keep your data current throughout the trading day.